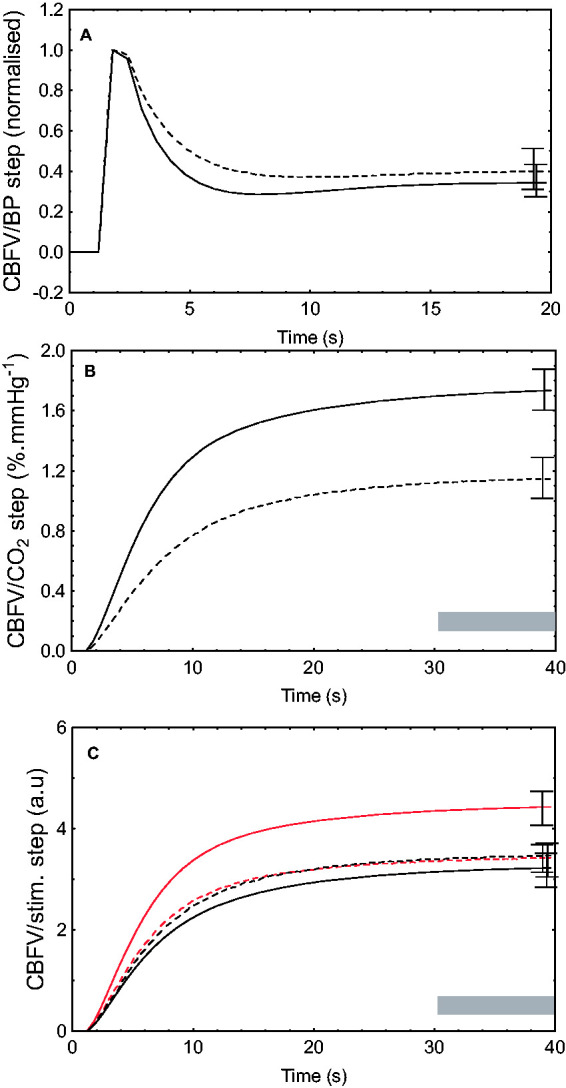
Figure 4.

Mean CBFV step responses to fluctuations in blood pressure (BP, a), end-tidal CO2 (b) and neural stimulation (c). In (a) and (b), solid line represents healthy controls (HC); dashed line, subjects with Parkinson’s disease. In (c), solid red line represents healthy controls dominant hemisphere; small dashed red line, HC non-dominant hemisphere; dotted black line, Parkinson’s patients non-onset hemisphere, solid black line, Parkinson’s patients onset hemisphere. CBFV, cerebral blood flow velocity. Error bars represent standard error of the mean at point of maximal occurrence. Grey shading represents time interval where mean value of the step response was calculated (Table 3).
