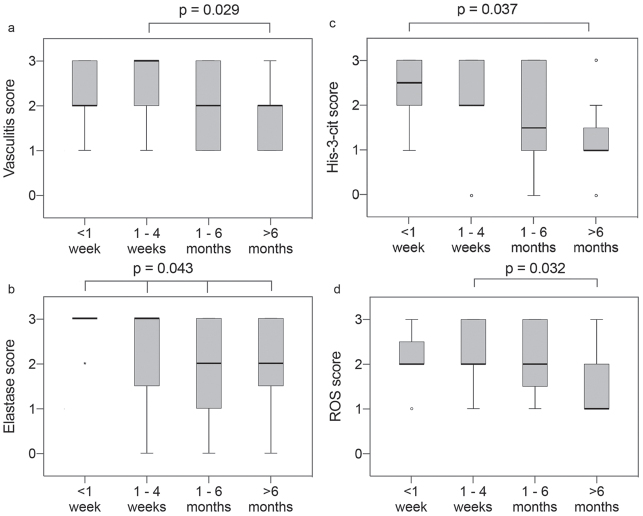
Fig. 3.
Boxplots – score distribution according to duration since onset of vasculitis for hypersensitivity vasculitis (HV), IgA and urticarial vasculitis (UV), < 1 week (n = 12), 1–4 weeks (n = 20), 1–6 months (n = 12), > 6 months (n = 16). The median is represented by the thick line across the box. The top and bottom box lines show the first and third quartiles. The whiskers show the maximum and minimum values, with the exceptions of outliers, which are represented by circles. (a) Vasculitis score, (b) elastase score, (c) His-3-cit score, (d) reactive oxygen species (ROS) score. p-value for difference between groups obtained using Kruskal–Wallis 1-way analysis of variance (ANOVA) for ordinal variables with pairwise comparisons using the Dunn-Bonferroni for post hoc analysis.

