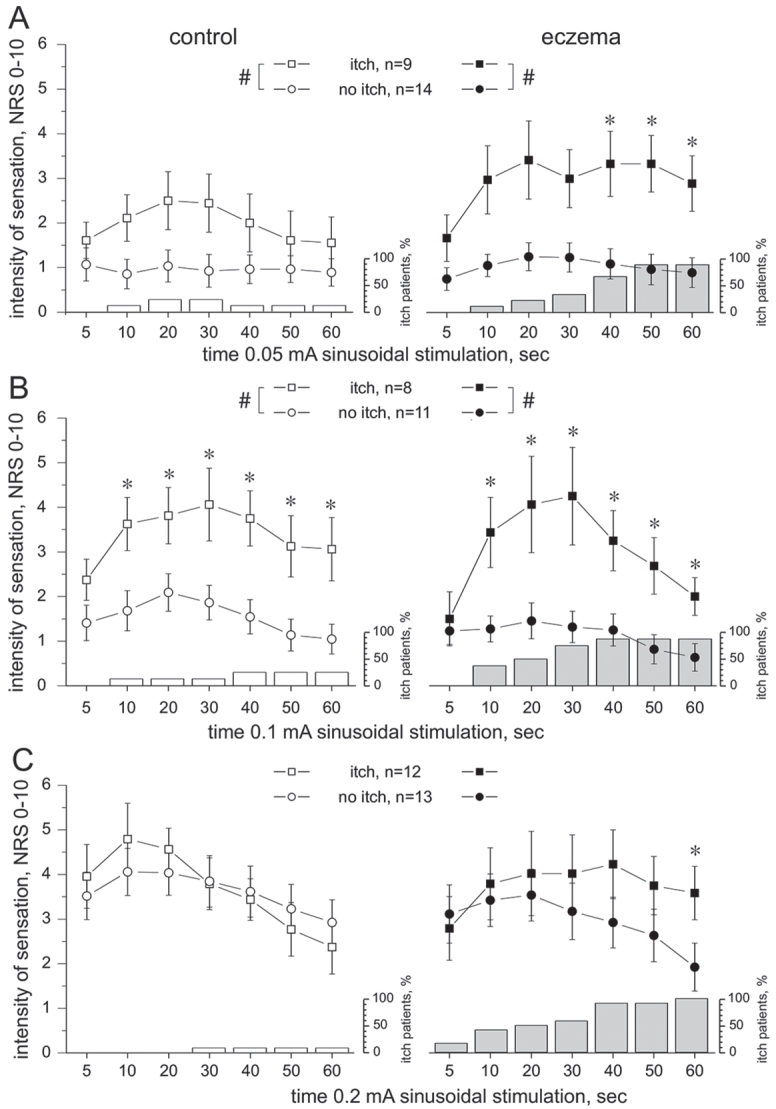
Fig. 3.

Time course of the intensity of sensation (numerical rating scale; NRS) recorded during 60 s lasting 4 Hz sine wave stimulation delivered to nonaffected control skin (left panel, open symbols) or eczema (right panel, solid symbols). Note that the number of patients perceiving itch in the eczema-affected skin increases the longer the sine wave stimuli were delivered (grey columns, depicted in % of patients reporting itch). Three patients felt itch when stimulating control skin (open columns). Error bars indicate standard error of the mean (SEM). (A) Sinusoidal currents of 0.05 mA evoked itch in 9 patients (squares), but pain in 14 patients (circle). The intensity of sensation was significantly different between the patient groups (itch vs non-itch, analysis of variance (ANOVA), #p < 0.02,), particularly in the eczema-affected skin during 40–60 s of stimulation (Mann-Whitney U test *p < 0.04). Also, 2 patients reported itch when stimulating control skin. (B) Sinusoidal currents of 0.1 mA evoked itch in 8 (squares) and pain in 11 (circles) patients with atopic dermatitis (AD). The intensity of sensation was significantly different between the groups (ANOVA, #p < 0.005) at 10–60 s of stimulation (Mann–Whitney U test, *p < 0.05) in both control skin (left panel) and eczema (right panel). (C) Continuous sine wave stimulation of 0.2 mA evoked in approximately 50% of patients itch (n = 12) and in 50% pain (n = 13). The intensity of sensation was not significantly different between the patient groups (itch vs no-itch, ANOVA, p > 0.05) or the skin sites (control vs eczema, ANOVA, p > 0.3), but pain declined continuously (solid circles), whereas itch remained significantly elevated in the eczema-affected skin (Mann–Whitney U test, *p < 0.04).
