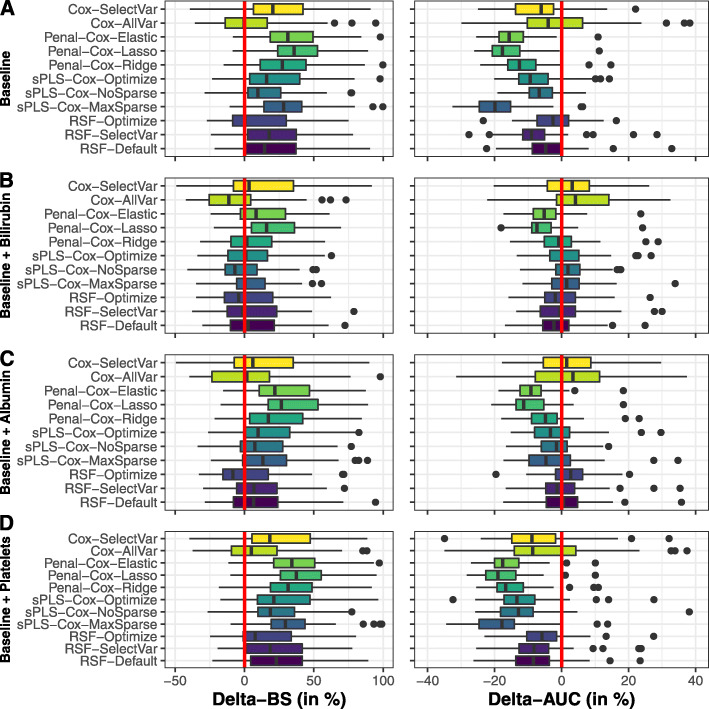
Fig. 5.
Assessment of 3-year survival probability in primary biliary cholangitis patients using baseline information on the 11 biomarkers and 3 covariates (figure A), baseline information and repeated measures collected up to 4 years of either serum bilirubin (figure B), albumin (figure C) or presence of platelets (figure D). The 10-fold cross-validation was replicated 50 times. The figure displays the difference (in percentage) of Brier Score (BS) and Area Under the ROC Curve (AUC) compared to the method using all the information with positive values for BS and negative values for AUC indicating a lower predictive accuracy

