
Figure 3.
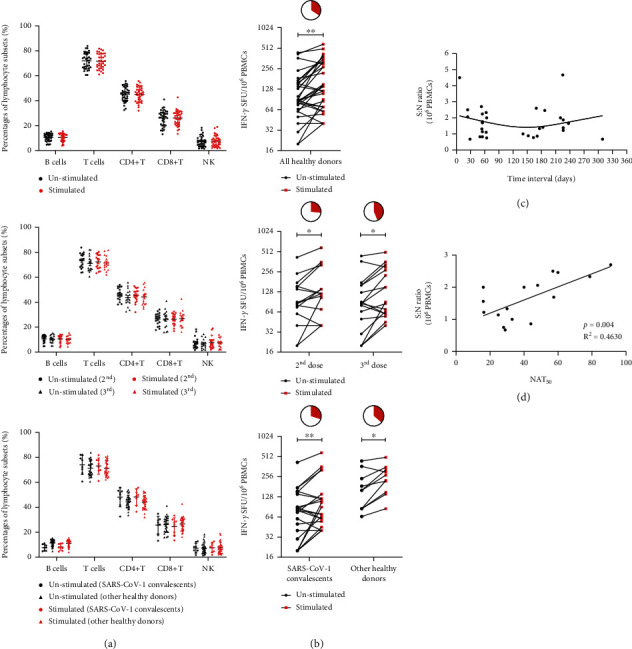
Cellular immune response to recombinant S-RBD proteins of Omicron in healthy donors. (a) The phenotypic analysis results of PBMCs from healthy donors before and after stimulation with Omicron S-RBD protein, followed by subgroup analysis of different vaccination statuses (having received the 2nd or 3rd dose of vaccination) and then the subgroup analysis between SARS-CoV-1 convalescents and other healthy donors. (b) IFN-γ ELISpot analysis of PBMCs from healthy donors to recombinant Omicron S-RBD proteins, followed by subgroup analysis of different vaccination statuses (having received the 2nd or 3rd dose of vaccination) and then the subgroup analysis between SARS-CoV-1 convalescents and other healthy donors. The pie charts represent corresponding proportions of positive ELISpot results within each group. (c) The signal-to-noise (S : N) ratio of SFU at different time intervals after the last dose of vaccine. (d) The correction analysis of signal-to-noise ratio and neutralizing antibody titers (NAT50) against Omicron S-RBD protein. ∗p < 0.05 and ∗∗p < 0.01.