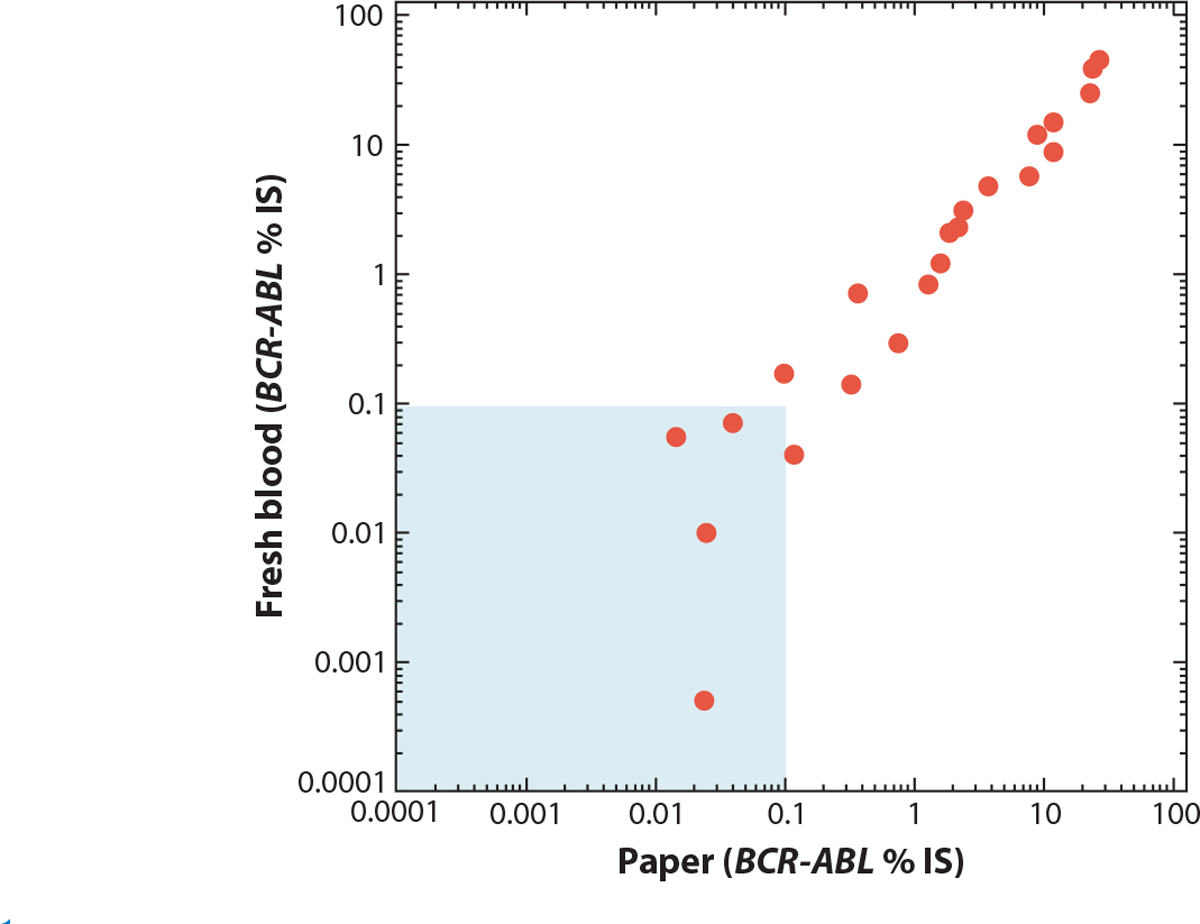
Figure 1.

Comparison of BCR-ABL RNA from fresh peripheral blood versus dried blood spots. Samples were taken from patients in Adelaide, South Australia. One aliquot was tested immediately, and the other was spotted onto paper, dried, and shipped by mail to Seattle, WA. The average transit time was over a month. The values are BCR-ABL/ABL percentage on the international scale (% IS). The shaded area is the level at or below a major molecular response. Figure adapted with permission from Reference 17.
