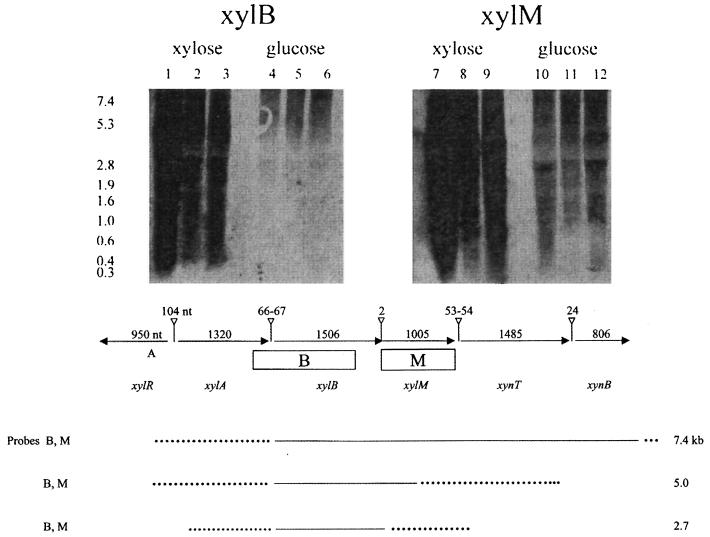
FIG. 4.
(Top) Autoradiograph of RNA isolated from xylose-grown and glucose-grown L. lactis IO-1, L. lactis 210, and L. lactis NRRL B-4449 probed with a region including xylB and xylM. Lanes 1, 4, 7, and 10, L. lactis 210; lanes 2, 5, 8, and 11, L. lactis NRRL B-4449; lanes 3, 6, 9, and 12, L. lactis IO-1. (Bottom) Transcription analysis of the xyl and xyn loci of xylose-grown L. lactis IO-1, L. lactis 210, and L. lactis NRRL B-4449. The top portion of panel B shows the organization and sizes of the genes (indicated by horizontal arrows) and intergenic regions (vertical lines ending in open triangles) and the locations of the Northern probes (rectangles). The bottom portion of panel B shows the predicted transcript boundaries (solid lines or, where there is uncertainty, broken lines). The transcripts (sizes indicated on the right) which hybridized to the probes (listed on the left) could lie anywhere within the depicted boundaries.

