
Figure 3.
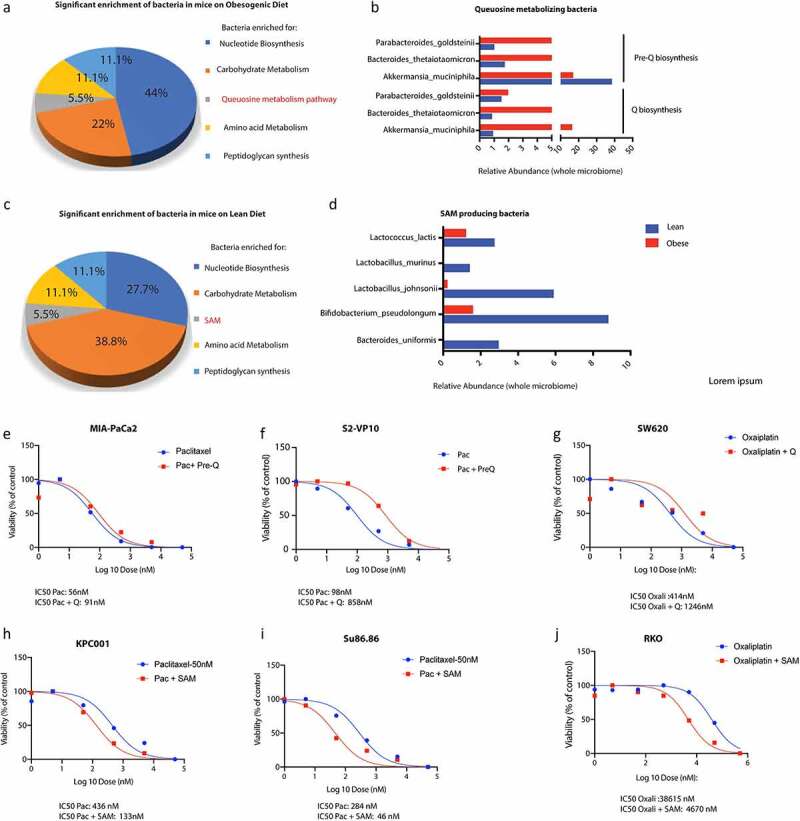
Metabolomic reconstruction using humaN2 pipeline was performed to determine the microbial metabolome. High fat diet fed mice showed an enrichment of Q metabolizing bacteria (a, b) while lean mice showed an enrichment of SAM metabolizing bacteria (c,d). Treatment of pancreatic cancer cells MIA-PACA2 (c) and S2VP10 (d) with paclitaxel and pre-Q showed a shift in IC50 indicating resistance. Treatment of colon cancer cell SW620 with oxaliplatin and pre-Q showed a similar shift in IC50 (e). Treatment of pancreatic cancer cells KPC001 (f) and Su86.86 (g) with SAM showed an opposite shift of IC50 indicating sensitization. Treatment of colon cancer cell RKO (h) with oxaliplatin and pre-Q showed a similar shift in IC50 indicating sensitization by SAM.