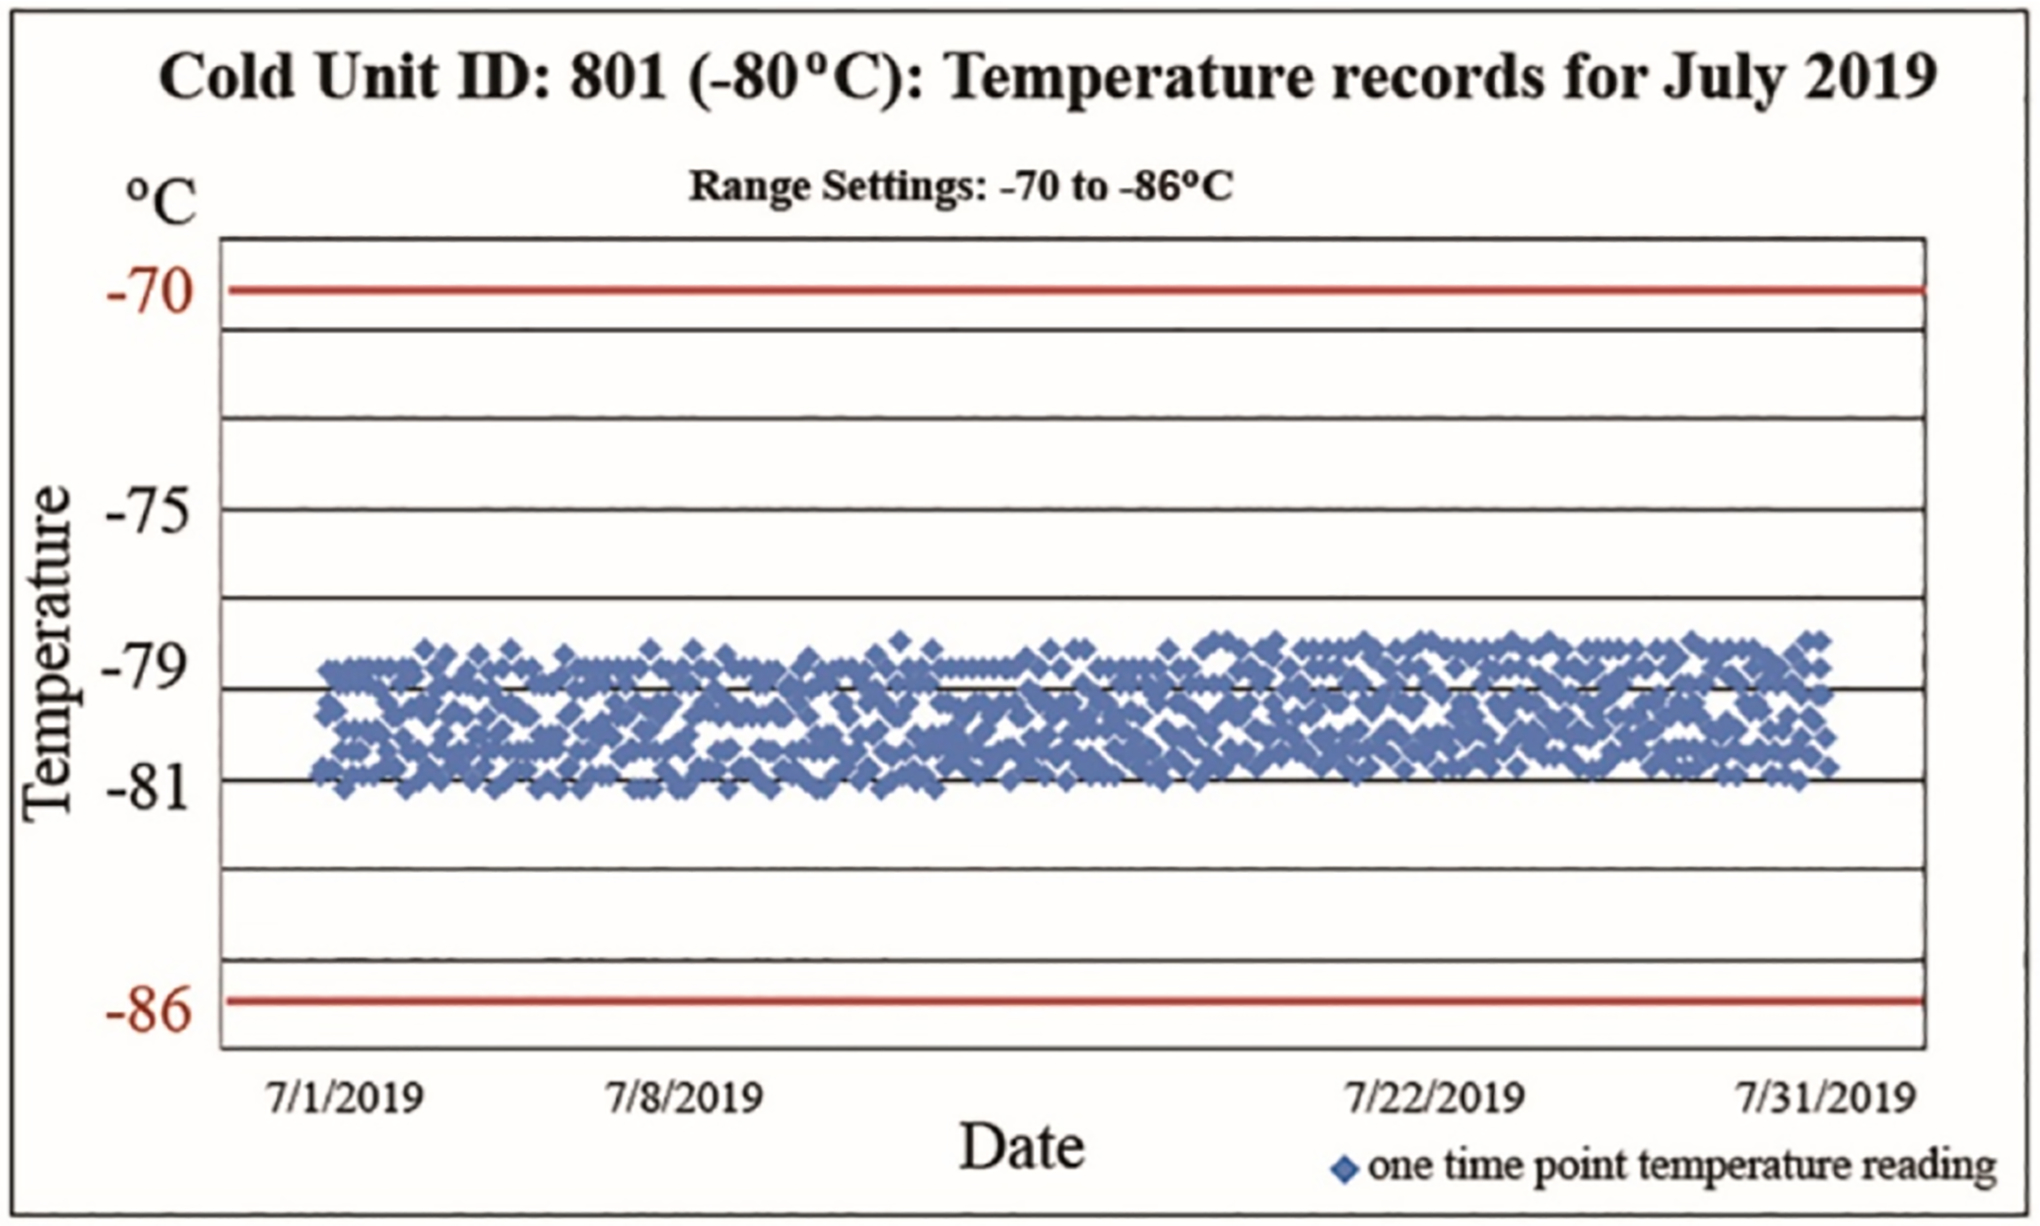
Fig. 2.

Monthly report of temperature recordings of a −80 °C cold unit as part of a specimen’s history. Every hour, temperature readings are automatically sent to a server and recorded in the log. The temperature range is set from −86 °C to −70 °C indicated by the red lines. The 24 daily data points were entered for entire months, here for the month of July 2019, showing the temperature history of the specimens stored in this specific unit.
