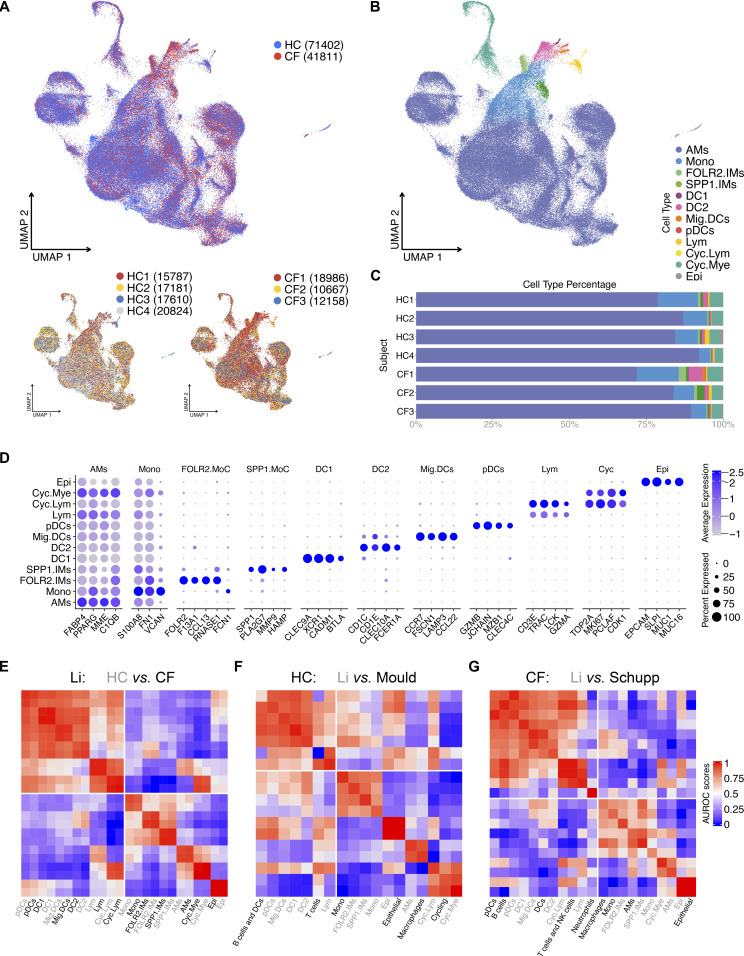
Figure 1. 12 BAL cell types identified in healthy control (HC) and CF samples.
(A) ScRNA-seq data show integrated UMAP with HC and CF, along with individual sample distribution. (B) UMAP demonstrating the 12 major cell types: alveolar macrophages, myeloid and lymphoid cycling cells (Cyc.Mye and Cyc.Lym), FOLR2 and SPP1 interstitial macrophages, monocytes (Mono), DC1, DC2, migratory DC (Mig.DC), plasmacytoid DCs (pDCs), lymphocytes (Lym), and epithelial cells (Epi). (C) Percentage bar graph outlines the distribution of individual cell types for each subject. (D) Dot plot shows the expression of curated genes in each individual cell type. (E) Correlation heat map of cell types against all samples in in-house dataset (Li). The lower quadrant highlights the corresponding cell types. (F) Correlation heat map of HC cell types in in-house and Mould dataset. The lower quadrant highlights the corresponding cell types. (G) Correlation heat map of HC and CF cell types in in-house and Schupp dataset. The lower quadrant highlights the corresponding cell types.

