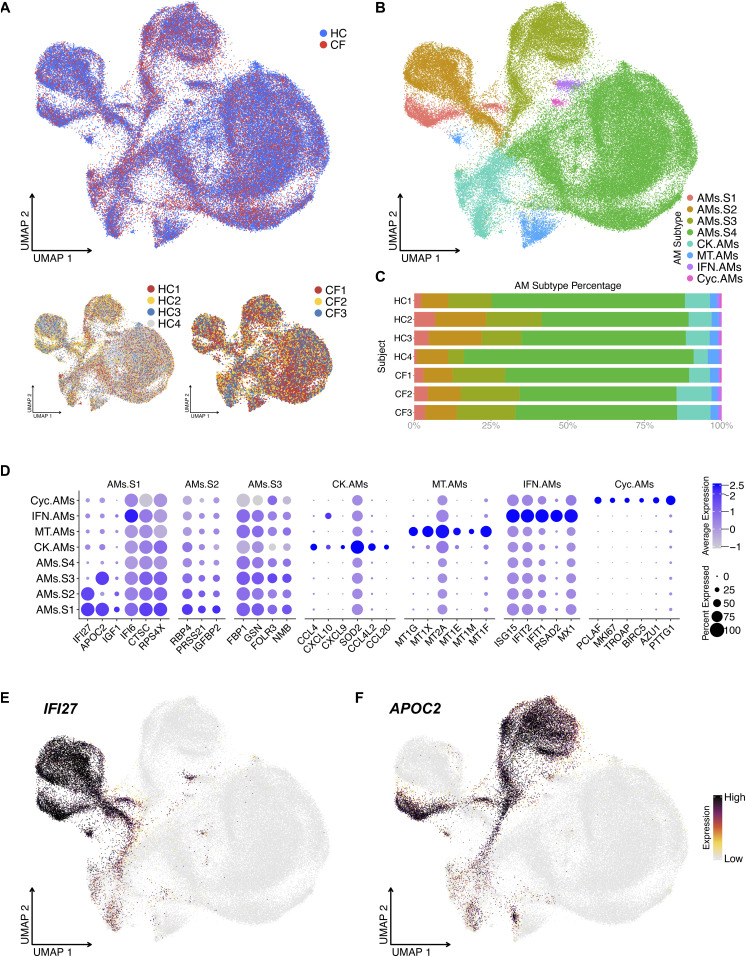
Figure 2. Unbiased analysis of scRNA-seq data illustrate four alveolar macrophage (AM) superclusters based on IFI27 and APOC2 expression.
(A) UMAP of re-clustered AMs shows sample source distribution. (B) UMAP shows distinct AM clusters: AM Supercluster 1 (AMs.S1), AMs.S2, AMs.S3 AMs.S4, metallothionein (MT.AMs), chemokine (CK.AMs), interferon (IFN.AMs), and cycling AM (Cyc.AMs) clusters. (C) Percentage bar graph outlines the distribution of individual AM clusters for each subject. (D) Dot plot shows the expression of the top 6 differentially expressed genes in individual AM clusters, duplicates removed. For example, AMs.S4’s top 6 differentially expressed genes are already present in the first three AM superclusters; therefore, AMs.S4 is seen on the Y axis but not the X axis. (E, F) Feature plot shows the expression of IFI27 and APOC2, which define the four AM superclusters.

