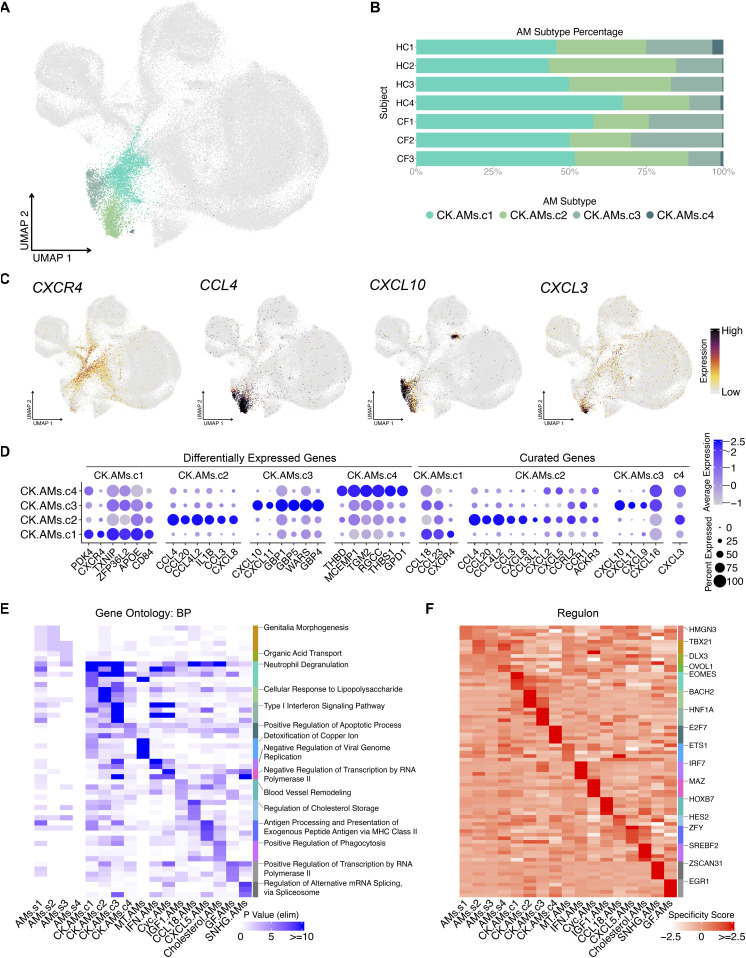
Figure 4. Chemokine alveolar macrophage (AM) subclusters express unique combinations of chemokines.
(A) UMAP illustrates distinct chemokine-expressing AM subclusters: CK.AMs.c1, CK.AMs.c2, CK.AMs.c3, and CK.AMs.c4. (B) Percentage bar graph outlines the distribution of individual chemokine-expressing AM subclusters for each subject. (C) Featured plots show four representative gene expression for individual chemokine-expressing AM subcluster. (D) Dot plot illustrates the expression of the top 6 differentially expressed genes (duplicates removed) and curated chemokine genes in individual chemokine-expressing AM subcluster. (E) Heat map shows the top 5 gene ontology terms (biological process) for each AM subtype. Top 1 term is labeled. (F) Heat map shows the top 5 regulons for each AM subtype. Top 1 regulon is labeled.

