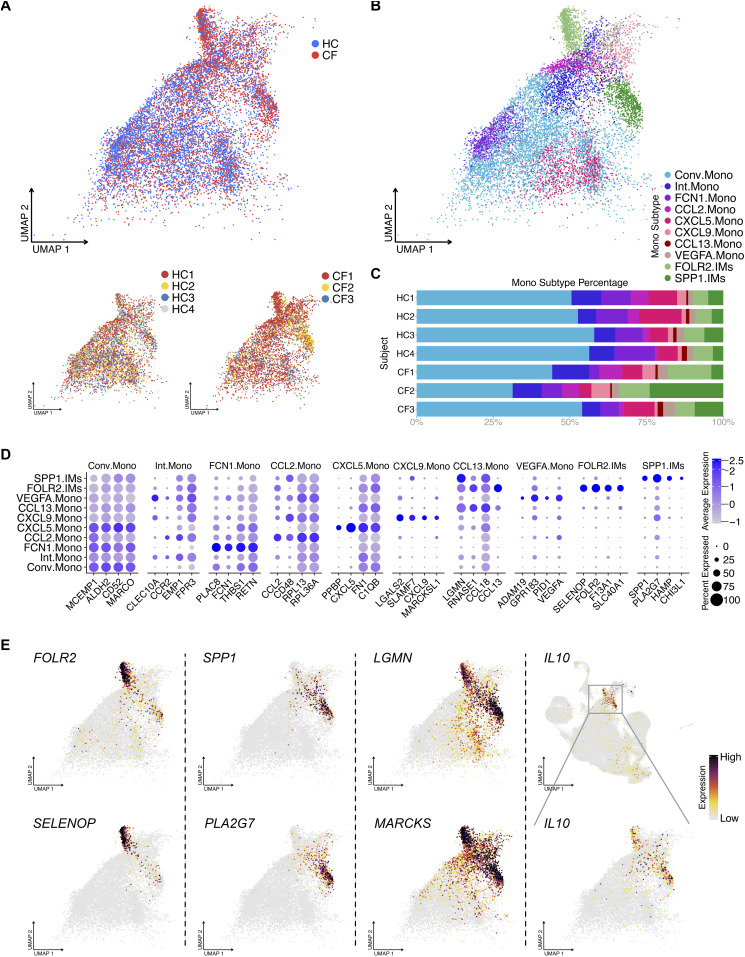
Figure 5. BAL monocytes and IMs contain heterogeneous clusters.
(A) UMAP of monocytes shows sample source distribution. (B) UMAP shows eight distinct monocyte clusters: conventional monocyte cluster (Conv.Mono) and intermediate monocyte cluster (Int.Mono) and others. (C) Percentage bar graph outlines the distribution of individual monocyte clusters for each subject. (D) Dot plot shows the expression of the top 6 differentially expressed genes in individual monocytes clusters, duplicates removed. (E) Featured plots show the expression of different differentially expressed genes of two IM clusters.

