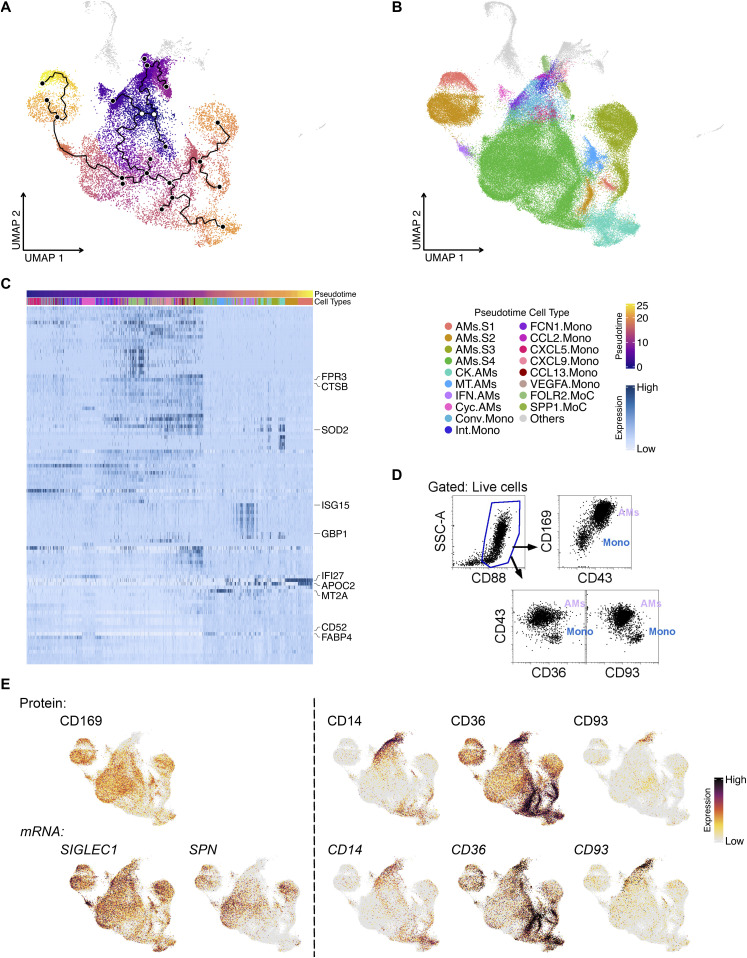
Figure 6. Pseudotime analysis of monocytes and macrophages in BALF.
(A) Pseudotime plot shows the evolvement of monocytes to macrophages with the root as white dots and the principal points as solid black dots. (B) UMAP shows distinct monocyte and macrophage clusters included for Pseudotime analysis. (C) Heat map shows the top 100 pseudotime differentially expressed genes across the monocyte-to-macrophage branch. Top 10 differentially expressed genes are labeled. (D) Flow cytometry plot illustrates the high expression of CD43 and CD169 on alveolar macrophages and CD93, CD36, and CD14 on monocytes. (E) Featured plots show representative gene expression and TotalSeq detection in alveolar macrophages and monocytes.

