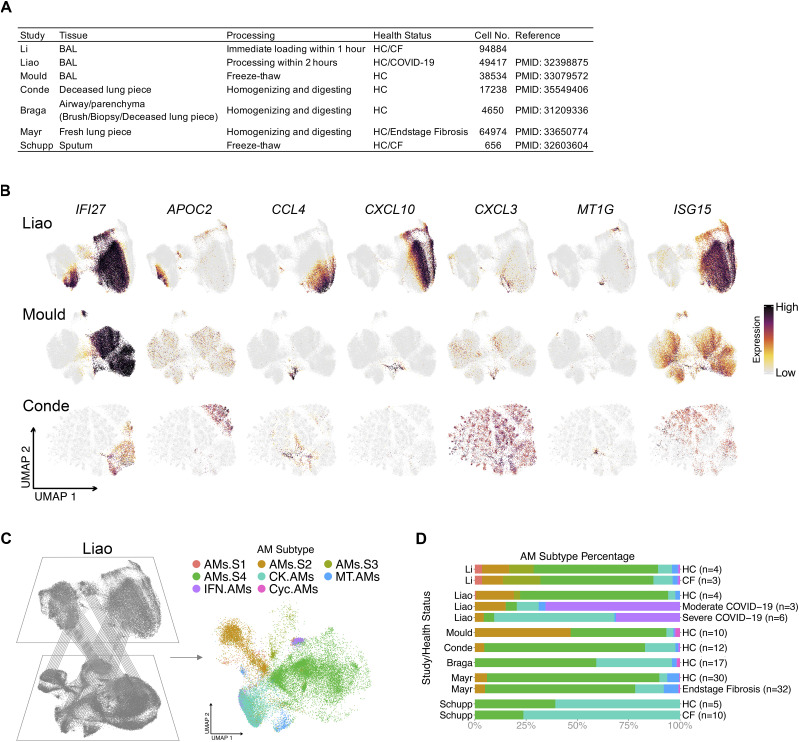
Figure 8. Alveolar macrophage (AM) superclusters are present in other publicly available datasets.
(A) AM summary table of publicly available datasets that were compared with our dataset. (B) Featured plots show the expression of seven selected AM cluster markers (IFI27, APOC2, CCL4, CXCL10, CXCL3, MT1G, and ISG15) in represented datasets. Only AMs were selected and re-clustered for UMAP visualization. (C) Schematic representation where reference mapping with Seurat package allows for the projection of publicly available datasets onto our AM supercluster-annotated dataset from Fig 2. (D) Percentage bar graph outlines the distribution of individual AM clusters for each health status in different datasets.

