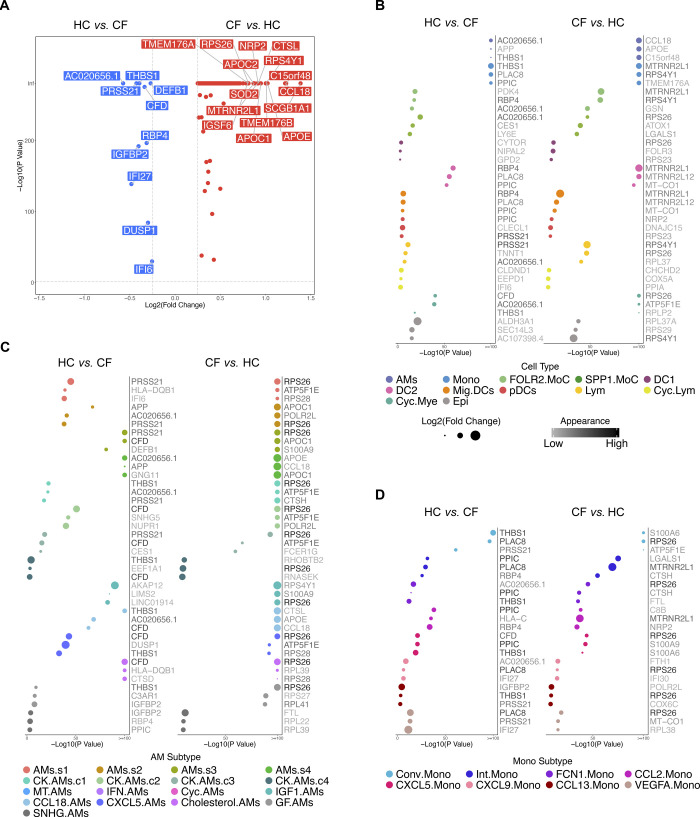
Figure S6. Gene expression analysis between HC and CF samples.
(A) Volcano plot demonstrates the differentially expressed genes (DEGs) in either HC or CF samples. Genes with a P-value smaller than 0.05 and log2 fold change larger than 25% are shown. Top 15 DEGs are labeled. (B) Dot Chart shows the top 3 DEGs in either HC or CF samples for the 12 major cell types. (C) Dot Chart shows the top 3 DEGs in either HC or CF samples for individual alveolar macrophage subtypes. (D) Dot Chart shows the top 3 DEGs in either HC or CF samples for individual monocyte subtypes.

