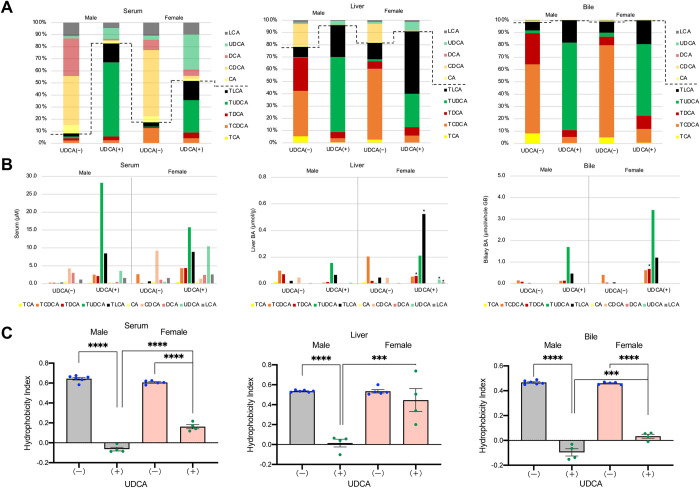
Fig 4. Comparison of BA compositions, concentrations, and hydrophobicity indices among serum, liver, and bile.
DKO mice at 20 weeks of age, with (+) or without (-) UDCA treatment, were compared. (A) BA compositions in serum, liver, and bile. The broken lines indicate the boundary between conjugated and unconjugated BAs. (B) BA concentrations in serum, liver, and bile. *P < 0.05 was considered statistically significantly different from UDCA treated male mice by the Tukey-Kramer test. (C) Hydrophobicity indices of total BAs in serum, liver, and bile. Each column and error bar represents the mean and SEM. **P < 0.01, ***P < 0.001, and ****P < 0.0001 were considered statistically significantly different by the Tukey-Kramer test.

