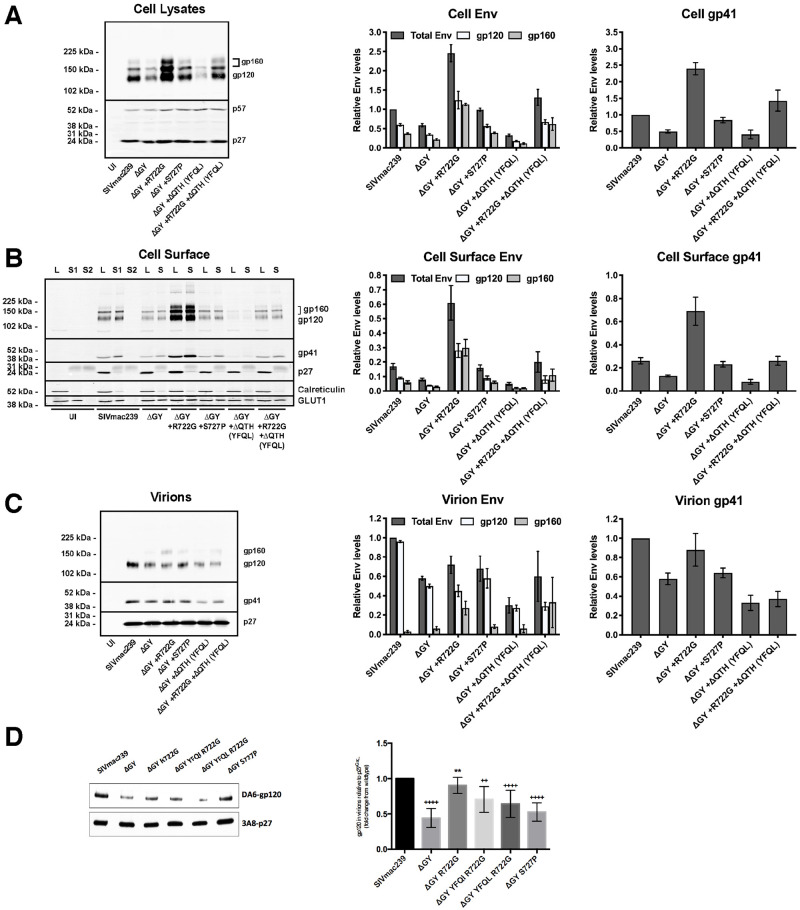
Fig 2. The ΔGY deletion and changes acquired in vivo modulate Env content on cells and virions.
Expression of total cell, cell surface and virion-associated Env was determined by western blotting using LLC-MK2 cells infected with viruses encoding the indicated Env. (A) Total cell associated Env in cell lysates. (B) Cell surface Env isolated by biotinylation and streptavidin pull-down (S = Surface); cell lysates (L = lysate) correspond to 20% of the pull-down input. A second pull-down (S2) was performed to show that all biotinylated proteins were captured in the first round. (C) Env associated with virions released into supernatant from cells shown in Panel A. (D) Env associated with virions produced from infected rhesus macaque PBMCs. Left panels show representative western blots; right panels show quantitation. Env levels are normalized to cell p57/p27 and relative to SIVmac239 (set at 1). The intensity of the processed (gp120) or unprocessed Env (gp160) is shown as the fraction of the total Env signal for each lane and relative to SIVmac239. Graphs display the mean ± SEM from n ≥ 3 independent experiments.

