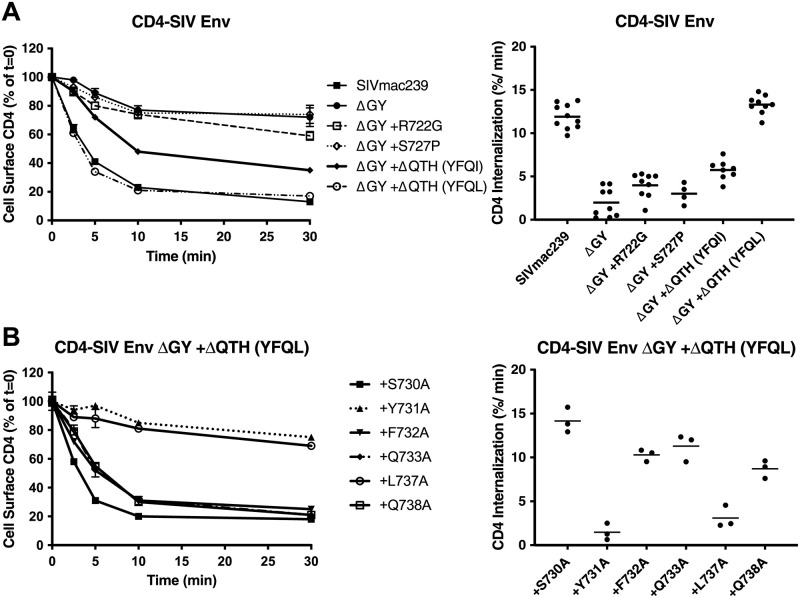
Fig 4. ΔGY and in vivo acquired a.a changes modulate endocytic rates.
(A) Endocytosis of CD4-SIV Env CD chimeras shown in Fig 3A in HeLa cells. (B) Endocytosis of CD4-SIV Env CD constructs containing ΔGY + ΔQTH (YFQL) with the indicated Ala substitutions (SIVmac239 a.a. numbering). Left panels show cell surface CD4 for the indicted times as a % of 0 mins (= 100%); right panels show the rate of endocytosis over the first 5 mins after warming up. Graphs display the mean ± S.E.M. (left) or mean and individual values (right) from ≥ 3 independent experiments.

