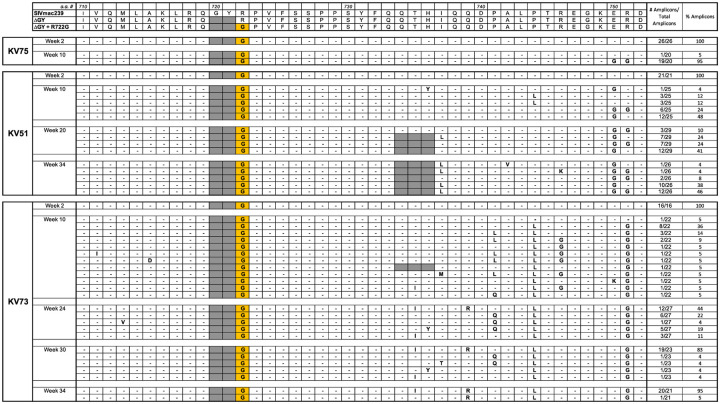
Fig 9. Viral evolution in PTM inoculated with SIVmac239ΔGY+R722G.
Summary of SGS of plasma virus performed at the indicated time points for 3 PTM inoculated i.v. with SIVmac239ΔGY+R722G. Results are shown for changes within a.a. 710–752 as in Fig 7. Sequences in the top panel show Env of SIVmac239, SIVmac239ΔGY and SIVmac239ΔGY+R722G. Complete CD a.a. sequences for individual amplicons are shown in S7 Fig.

