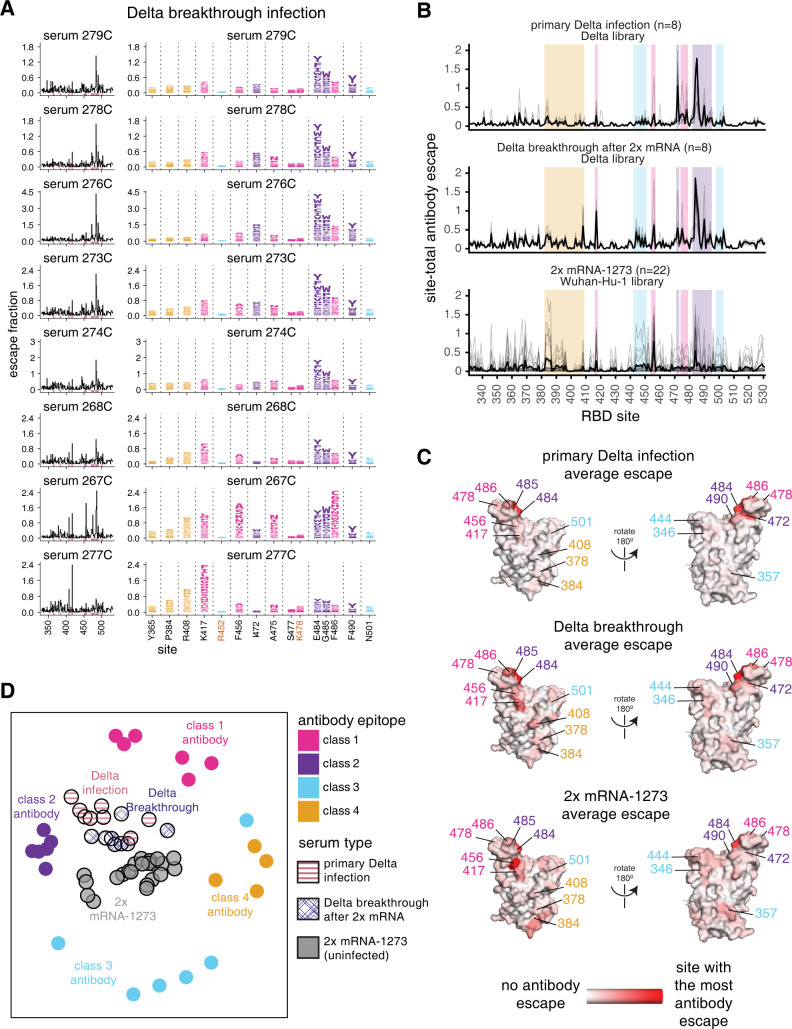
Fig 5. Delta breakthrough infection after 2x mRNA vaccination elicits an antibody response focused on the class 1 and 2 epitopes.
(A) Complete maps of mutations that reduce binding of plasma antibodies to the Delta RBD from individuals convalescent of Delta breakthrough infection. The same sites as in Fig 3B are shown in the logo plots and highlighted in pink in the line plots. Logo plots for both cohorts are shown side-by-side in S6 Fig. (B) Site-total antibody escape averaged across each group of plasmas for primary Delta convalescent plasmas, Delta-breakthrough convalescent plasmas, and previously published mRNA-1273-vaccinated sera [29], with key epitope regions highlighted (key in panel D). (C) Site-total antibody escape averaged across each group mapped to the RBD surface, with red indicating the site with the most antibody escape and white indicating sites with no escape. The Delta primary infection and Delta breakthrough plasmas were mapped against the Delta RBD libraries, and the mRNA-1273 sera were mapped against the Wuhan-Hu-1 RBD libraries. Site labels are colored by epitope. (D) Multidimensional scaling projection with the distance between points representing the dissimilarity between antibody-escape maps, comparing primary Delta infections, Delta breakthrough after 2x mRNA vaccination convalescent plasmas, and mRNA-1273-vaccinated sera with monoclonal antibody escape maps of the 4 classes used as anchors, first reported in [22,24,42–44]. The antibody-escape maps for mRNA-1273 vaccine-elicited sera were first reported in [29], and primary Delta and Delta breakthrough infections are new to this study. The primary Delta infection escape maps are replicated from Fig 4. Interactive versions of logo plots and structural visualizations are at https://jbloomlab.github.io/SARS-CoV-2-RBD_Delta/. The complete antibody-escape scores are in S3 Data and online at https://github.com/jbloomlab/SARS-CoV-2-RBD_Delta/blob/main/results/supp_data/aggregate_raw_data.csv.

