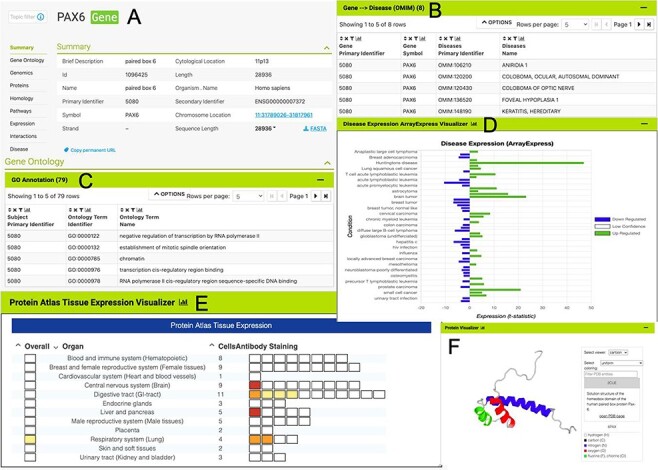
Figure 2.

The PAX6 report page. Report pages present data through a range of interactive tables, graphs and visualizations depending on the data type. A selection of features from the report page for the human PAX6 gene are shown here. (A) A summary of the main identifiers and chromosomal location. (B). An interactive table of Gene Ontology annotations. Only the first five rows are shown. (C). A table of disease annotations (original data source: OMIM, https://www.omim.org). Only the first five rows are displayed. (D). A graph showing up- and downregulation of the PAX6 gene in various disease conditions (original data from ArrayExpress experiment E-MTAB-62, https://www.ebi.ac.uk/arrayexpress/experiments/E-MTAB-62). (E). A graph showing protein localization data (from the Protein Atlas project, https://www.proteinatlas.org/humanproteome/tissue.). (F). A protein structure viewer pulling in data from the Protein Data Bank (https://www.rcsb.org).
