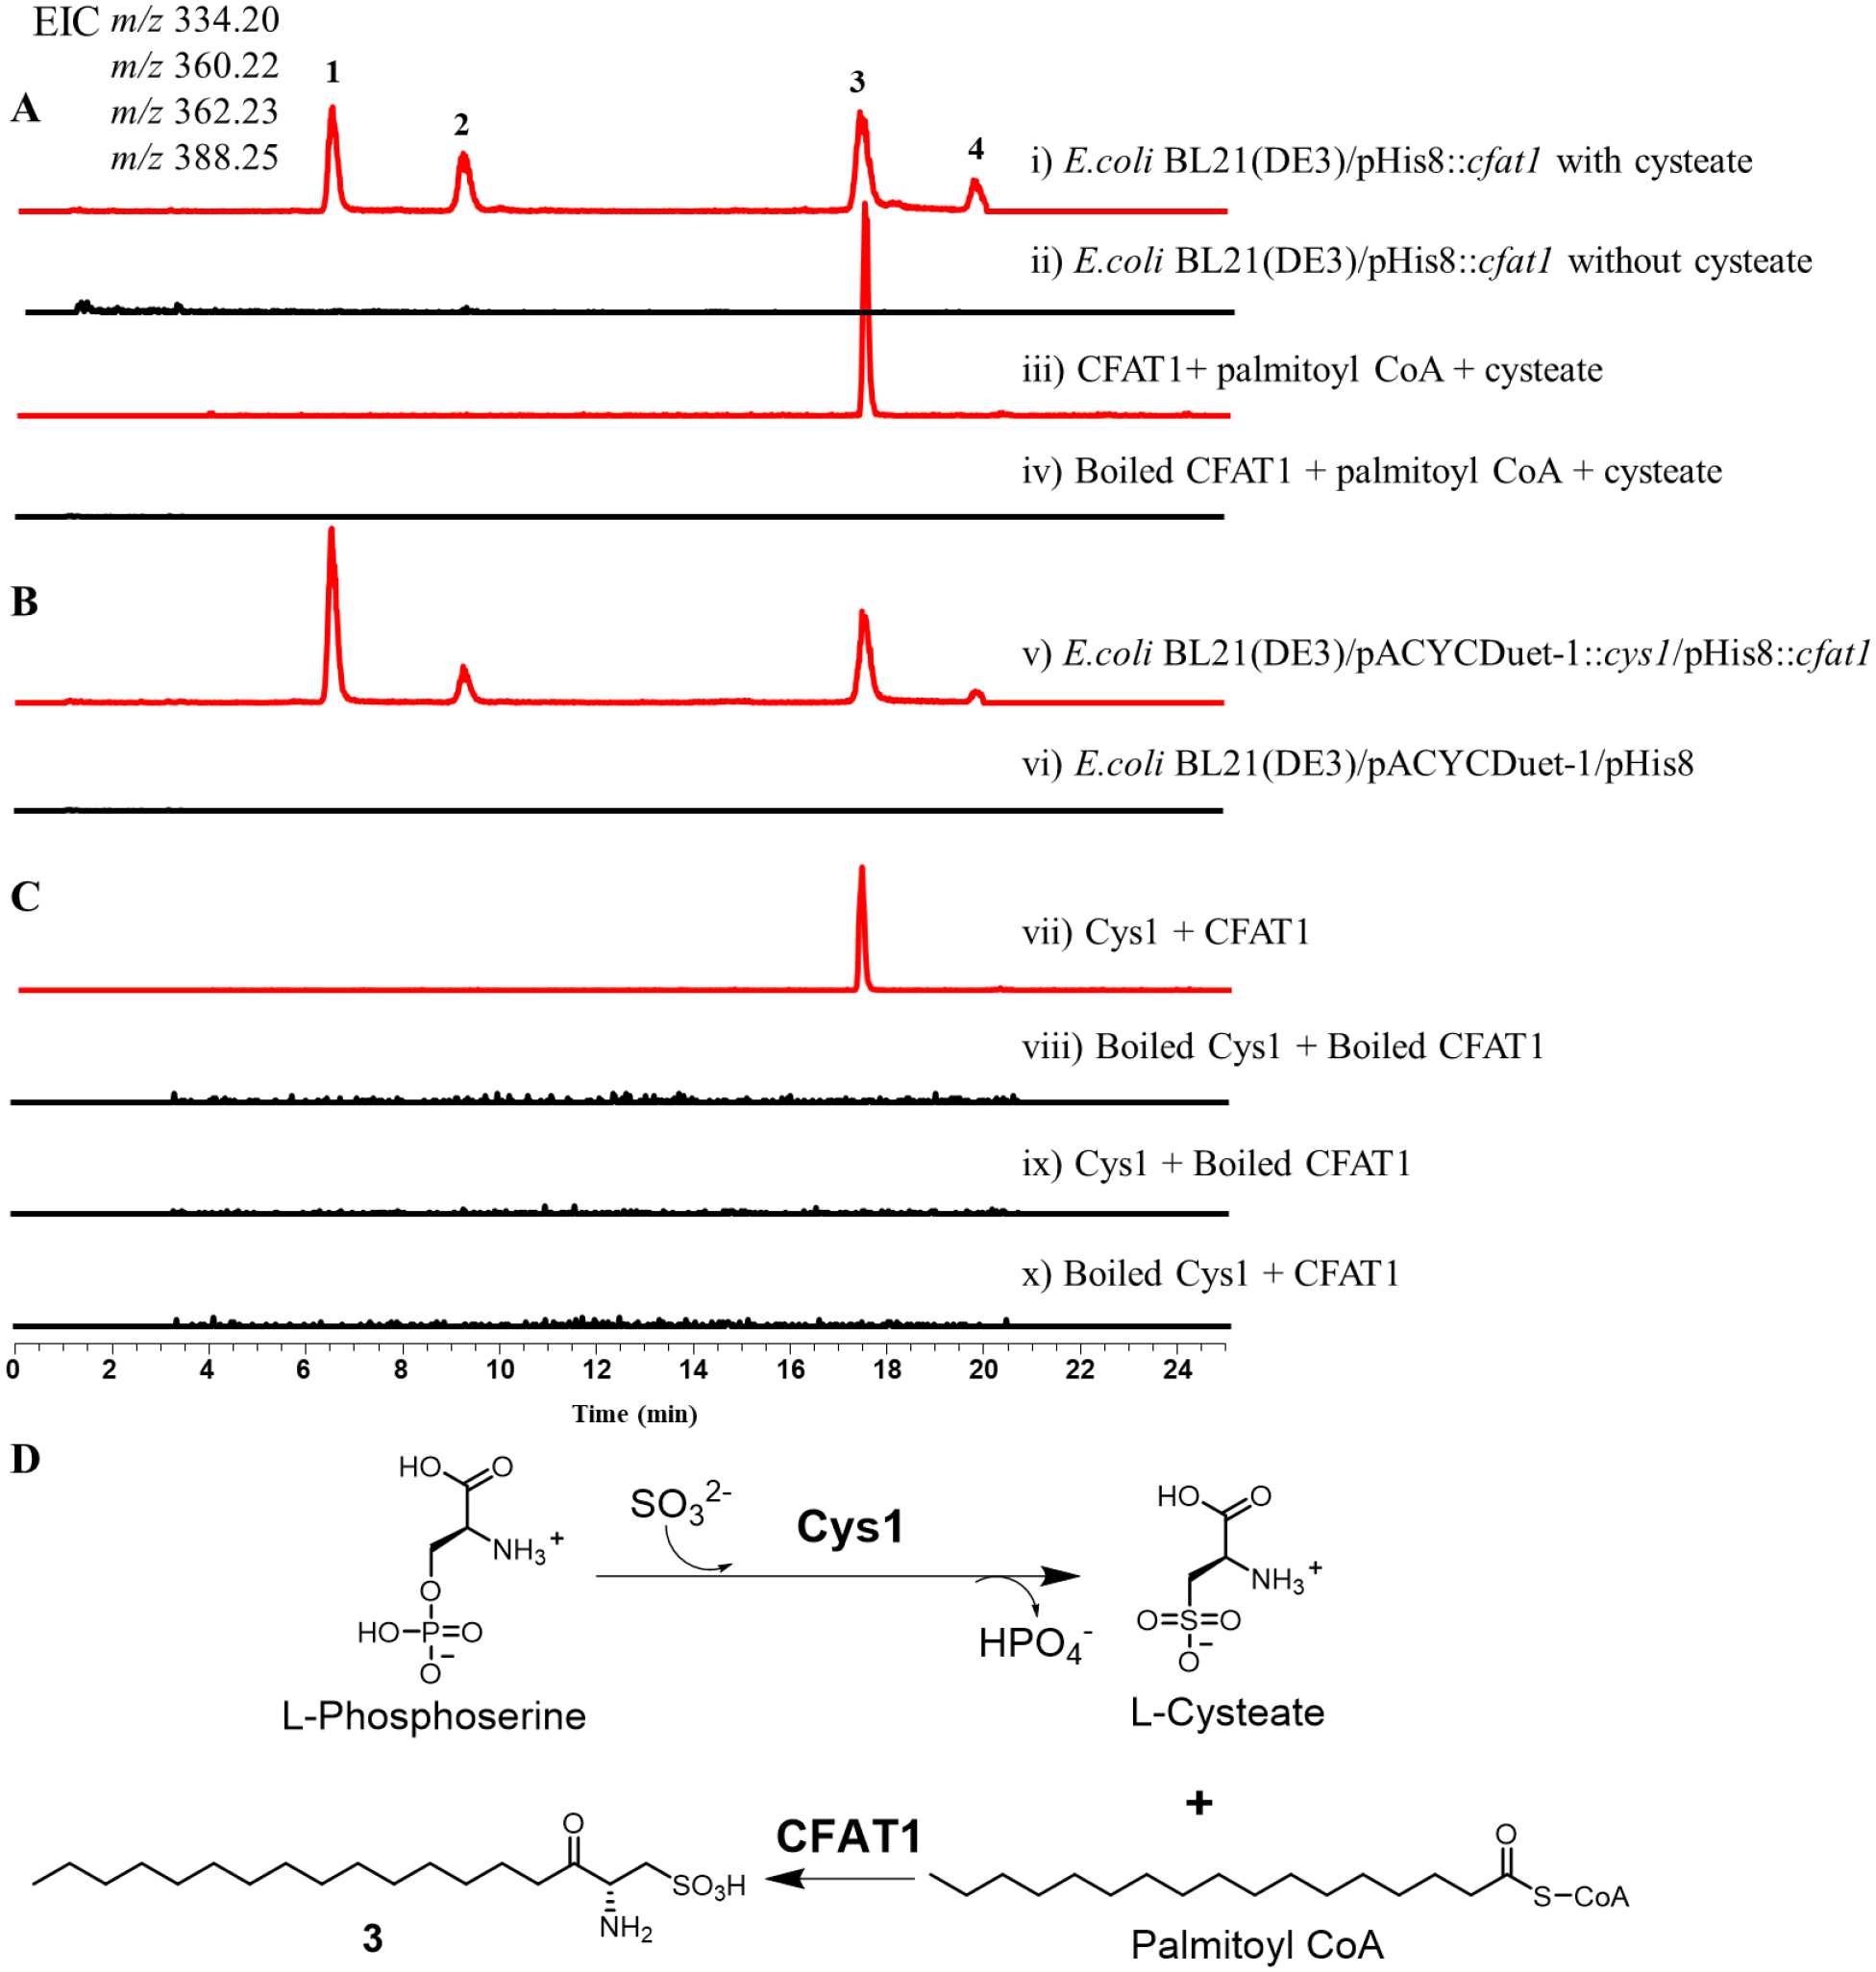
Figure 5. Comparative LC-ESI analysis of production of key enzymatic conversions.

The extracted ion chromatograms (EICs) were shown at m/z 334.20 [M - H]− for 1, m/z 360.22 [M - H]− for 2, m/z 362.23 [M - H]− for 3, and m/z 388.25 [M - H]− for 4. (A) Production of E. coli BL21(DE3)/pHis8::cfat1 fed with cysteate or not (i and ii) and in the in vitro CFAT1 reaction (iii and iv). (B) Production of E. coli BL21(DE3)/pACYC::cys1/pHis8::cfat1 (v) and E. coli BL21(DE3)/pACYC/pHis8 (vi). (C) One-pot assay of Cys1 and CFAT1(vii, viii, ix and x). (D) The biosynthetic pathway of 3.
