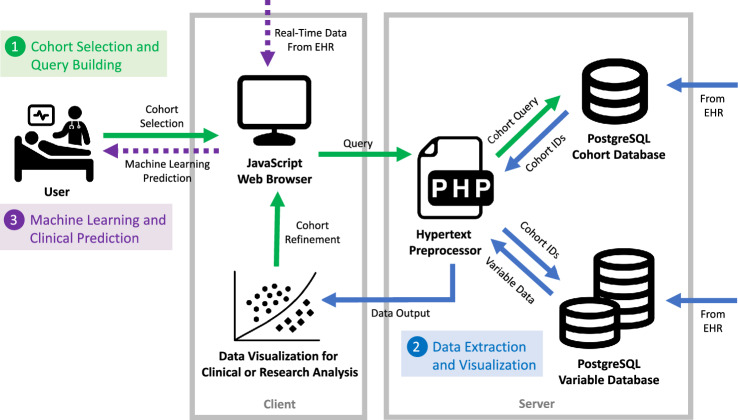
Fig. 1.
Overview of the Opal dataflow structure. The dataflow of Opal is outlined in three phases: cohort selection, data extraction and visualization, and machine learning prediction. A cohort is first specified by the user to build a query for the Opal database. Data is then extracted via a two-step process with a superficial query of the cohort database to identify appropriate case IDs followed by a detailed query of the variable database to extract data from those cases for output. Once data has been extracted to the client, the user has the opportunity to visualize the data on the Opal dashboard, refine the cohort to better match the desired specifications, or export the data to an external platform for model training or any other research application. If machine learning prediction is desired the user can upload model parameters back into the Opal client, which can then use real-time data asynchronously from the EHR to generate live predictions. Icons used in generating this diagram were obtained from the Noun Project and are cited in the article references. EHR electronic health record, ID identifier

