Fig. 5.
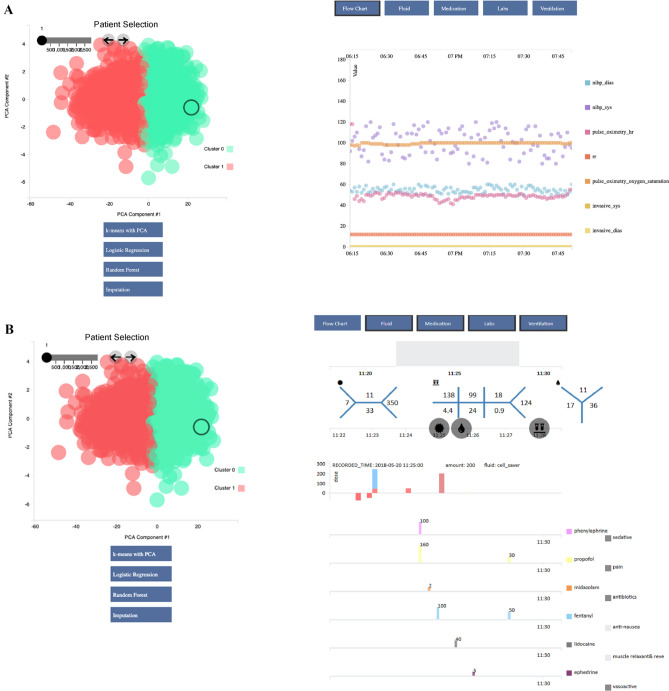
K-means clustering of intraoperative vitals. 2,995 unique cases were extracted from the Opal database and were visualized on the Opal web client for unsupervised machine learning analysis. K-means clustering was performed on the cohort to partition the cases into two clusters. Individual cases were chosen for case review by clicking each circle from the data visualization graph on the left. Case data from the selected case was displayed corresponding to the data categories in the blue toolbar and time frame on the grey timeline selected by the user on the upper right-hand side. Different combinations of the vital signs flowchart, laboratory values, fluids, and medications can be selected at once for viewing. Supervised machine learning architectures including logistic regression and random forest can also be performed by the web application to allow the user to compare a prospective patient with similar past cases. After reviewing the cohort, the user may modify the list of cases to better match his or her research or clinical needs and may export the data to an external platform for further analysis. A Individual case analysis of vital signs flow chart. B Individual case analysis of laboratory values, fluid administration, and medications. dbp diastolic blood pressure, h heart rate, PCA principal component analysis, po pulse oximetry, rr respiratory rate, sbp systolic blood pressure. The numbers separated by the blue lines in the top right of the image are the laboratory values of the patient showing the Complete Blood Count (CBC), Chemistry 7 (CHEM 7), and coagulation (COAG) in the traditional “fishbone” shorthand representations of these laboratories regularly used in United States medical centers

