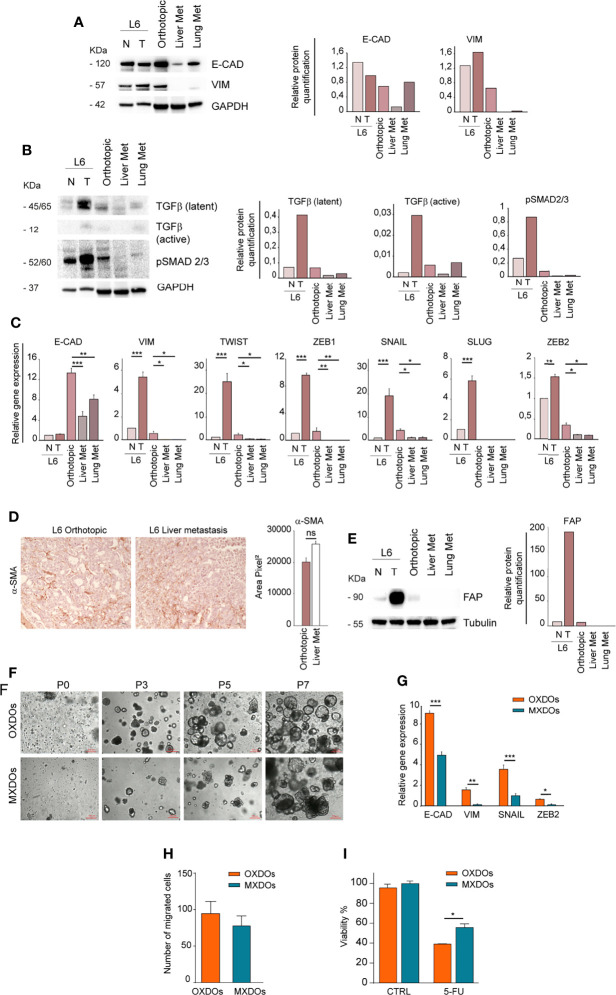
Figure 4.
Metastatic tissues lose mesenchymal traits and acquire increased chemoresistance. (A) Left: comparative immunoblot analysis of E-Cadherin (E-CAD) and Vimentin (VIM) on whole lysates of normal/peritumoral mucosa (N) and tumor tissue (T) of patient L6, orthotopic xenograft (Orthotopic), liver and lung xenograft metastases (Liver Met and Lung Met). GAPDH was used as a loading control. Right: quantification of the immunoblot experiment shown on the left. (B) Left: comparative immunoblot analysis of phosphorylated SMAD 2/3 (pSMAD 2/3) and TGF-β on whole lysates as described above. Right: quantification of the immunoblot experiment shown on the left. (C) qRT-PCR analysis of E-Cadherin (E-CAD), Vimentin (VIM), Twist, ZEB1, SNAIL, SLUG, and ZEB2 in normal/peritumoral mucosa (N) and tumor tissue (T) of patient L6, orthotopic xenograft (Orthotopic), liver and lung xenograft metastases (Liver Met and Lung Met). Mean ± SD of 3 experiments. *P < 0.05, **P < 0.01 and ***P < 0.001 from two-tailed Student’s t test. (D) Staining of alpha Smooth Muscle Actin (αSMA) on sections of L6 orthotopic PDX and hepatic metastasis (left) and quantification of 5 sections (right). Magnification 20x, ns non-significant. (E) Left: Immunoblot analysis of human Fibroblast Activation Protein (FAP) in normal (N) and tumor (T) parental tissues of L6 patient, in orthotopic PDX (Orthotopic) and metastatic PDX (Liver Met and Lung Met). Tubulin was used as loading control. Right: quantification of the immunoblot experiment shown on the left. (F) Time course of organoid generation (orthotopic xenograft-derived organoids, OXDOs and metastatic xenograft-derived organoids, MXDOs), from the first day of culture (passage 0, P0) to subsequent passages (P3, P5 and P7, respectively after 3 weeks, 5 weeks and 7 weeks of culture). Magnification 10x. Bar 100 μM. (G) qRT-PCR analysis of E-Cadherin (E-CAD), Vimentin (VIM), SNAIL and ZEB2 on OXDOs (orange bars) and MXDOs (blue bars). *P < 0.05, **P < 0.01 and ***P < 0.001 from two-tailed Student’s t test. (H) Invasion/migration assay performed with OXDOs and MXDOs. (I) Cell viability of OXDOs (orange bars) and MXDOs (blue bars) treated with 5 μM 5-Fluorouracil (5-FU) for 6 days. Values represent mean ± SD of three independent experiments. *P < 0.05 by unpaired Student’s t test.

