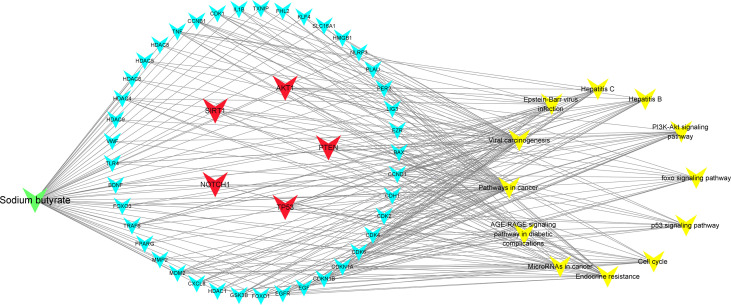
Figure 11.
Compound-targets-pathways map was constructed using Cytoscape 3.8.2 software. The compound (sodium butyrate) was green node, targets were blue and red nodes, and pathways were showed by yellow nodes, respectively. The red represents the 5 core target genes. The edges represent the interactions among them.

