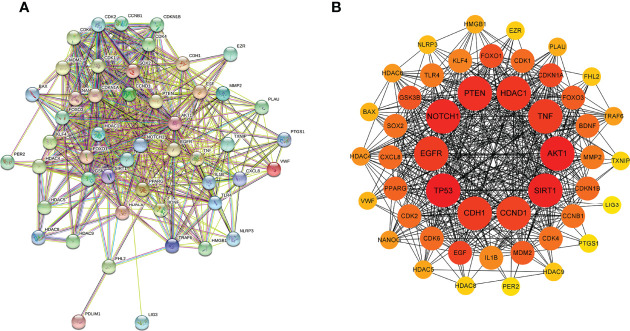
Figure 3.
Protein-protein interaction (PPI) network of the 51 intersectional genes was analyzed by STRING database (A) and the hub targets network including the top 10 targets were constructed by cytoHubba plug-in (B). In the hub targets network, the larger the node and the redder the color represent the stronger the interaction degree.

