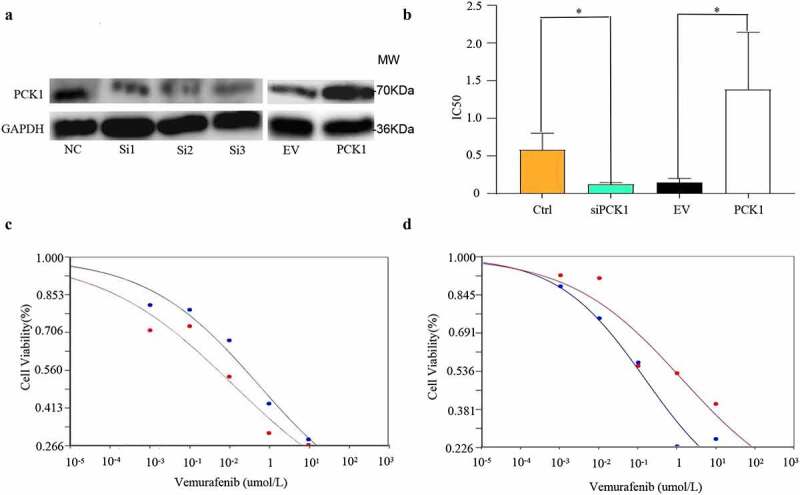
Figure 3.

Effect of PCK1 on the chemoresistance in melanoma cells.
A. Western blot: the melanoma cell lines with low expression and overexpression of PCK1 were constructed successfully. B. IC50 figure: Knockdown of PCK1 shows low cell viability under vemurafenib, and overexpression shows high (* p < 0.05). C. Cell viability curve: the blue refers to the control, and the red refers to the knockdown (siPCK1). D. Cell viability curve: the blue represents the empty virus (EV), and the red represents the overexpression (PCK1).
