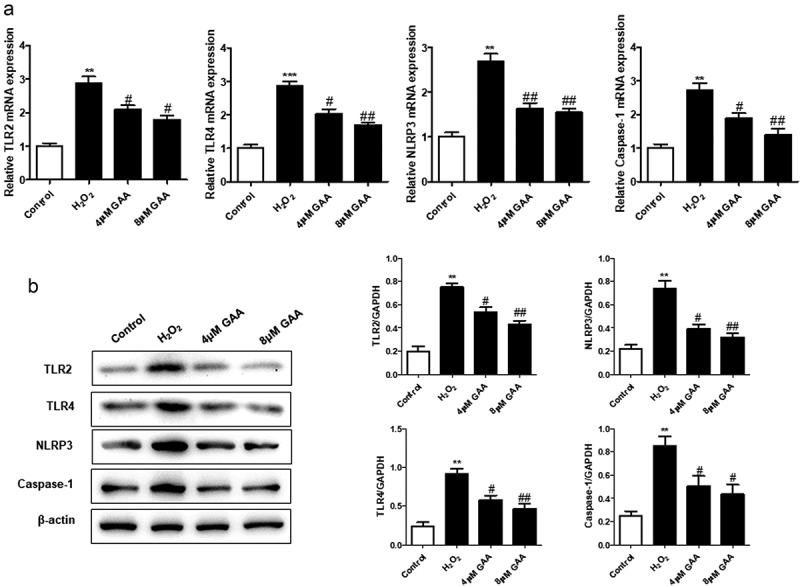
Figure 6.

GAA suppresses H2O2-induced TLR4/NLRP3 signaling pathway activation in NP cells.
(a) Quantitative PCR showing expression of TLR2, TLR4, NLRP3, caspase-1. (b) Western blot analysis of relative protein expression levels. Values are presented as mean ± standard deviation (SD). *p < 0.05, **p < 0.01, ***p < 0.001, as compared to control. #p < 0.05, ##p < 0.01, ###p < 0.001, as compared to H2O2.
