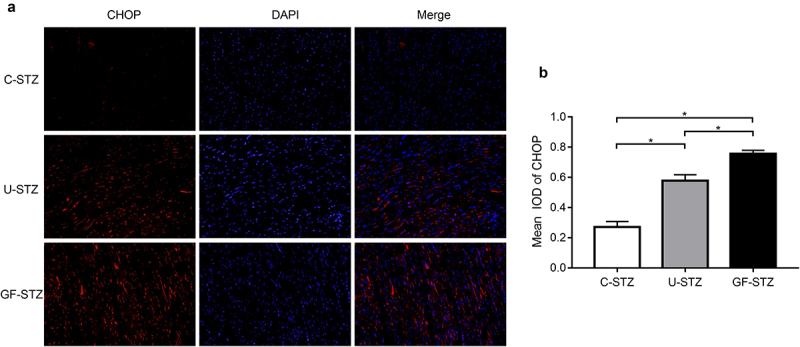
Figure 5.

Effect of glucose fluctuation on CHOP expression in rat hearts of different groups (a) Representative CHOP immunofluorescence images of myocardial tissue sections of the left ventricle. (b) Integrated optical density of CHOP immunofluorescence images of different groups. C-STZ: controlled diabetic group; U-STZ: uncontrolled diabetic group; GF-STZ: glucose fluctuated diabetic group. n = 5 per group, *P < 0.05.
