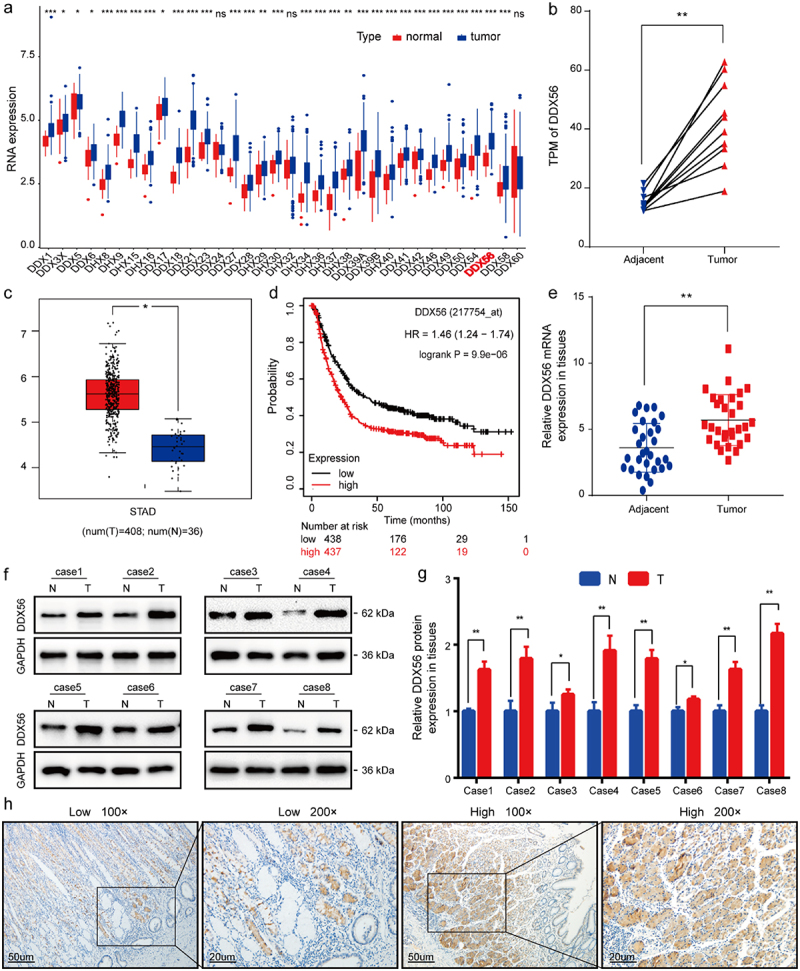
Figure 1.

Identification and validation of a novel oncogenic DDX56 gene in human GC tissues. (a) The Box plot showing DDX family gene expression within GC tissues and normal gastric mucosa using ‘ggpubr’ package in R. (b) A total of 10 paired GC tissues were analyzed by high-throughput sequencing. RNA-seq data were reported as TPM to plot a dot line chart. (c) The Box plot presenting the DDX56 gene expression levels in GC and normal tissues from the TCGA-STAD project. (d) K-M curve showing OS according to different DDX56 expression levels using TCGA. (e) Relative DDX56 mRNA levels were compared between GC samples (n = 30) and normal gastric tissues (n = 30). (f, g) Relative expression levels of DDX56 protein in GC and adjacent normal tissues were normalized to GAPDH level. (h) IHC staining of DDX56 expression in human GC tissues and normal adjacent tissues. Asterisks stand for statistically significant differences: * P < 0.05, ** P < 0.01, *** P < 0.001, **** P < 0.0001. Abbreviations: TPM, Transcripts Per Million; STAD, stomach adenocarcinoma; N, normal; T, tumor.
