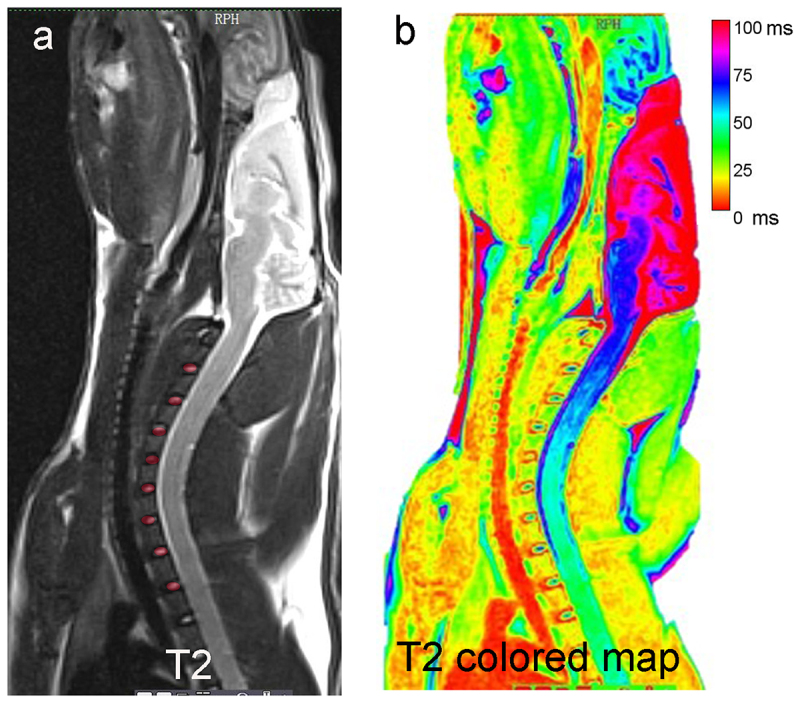
Figure 3.

Schematic diagram of T2 value and disc volume MRI measurements. (a) ROI was selected for the IVDs in T2WI, disc volume = the area of ROI multiplies by the number of layers of the MRI scan, (b) disc and endplate T2 relaxation times were measured in T2 colored map.
