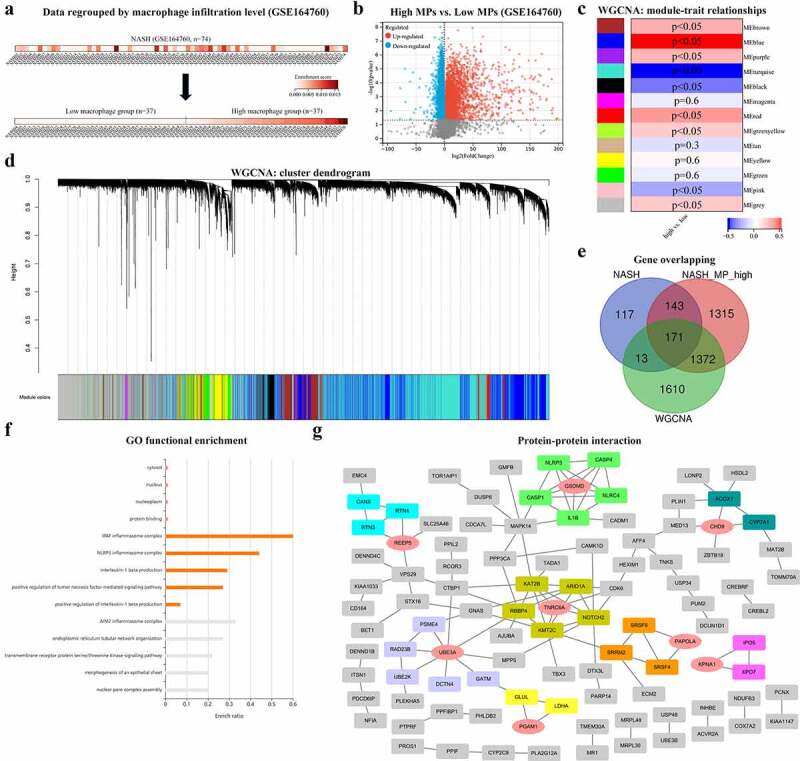
Figure 4.

(a) NASH samples of GSE164760 are grouped with MP ES from Xcell (low MP: ES = 0 and high MP >0). (b) Both significantly up- and downregulated DEGs were screened out from regrouped NASH samples of GSE164760 and displayed in the volcano plot. MP-associated gene cluster is selected with WGCNA. Module–trait relationships (c) and cluster dendrogram (d) are shown in charts. (e) 171 overlapping genes are generated from high DEGs of GSE164760 and regrouped NASH samples, as well as WGCNA gene cluster. GO enrichment analysis (f) and PPI analysis (g) are carried out from 171 overlapping genes. Hub genes are labeled in red and round shape. p < 0.05 is regarded as statistical significance.
