
Figure 1.
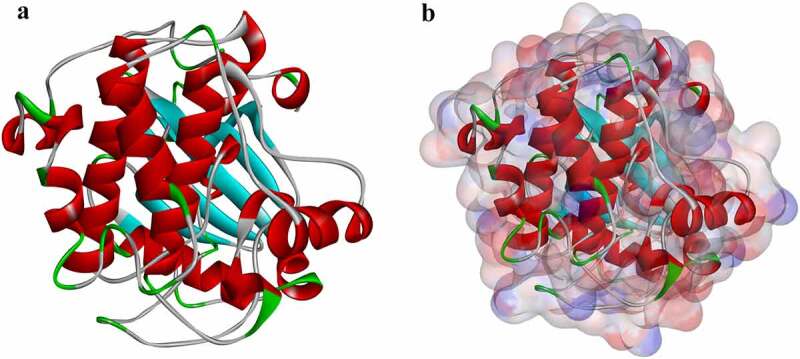
Molecular structure of AKT1. (a) Initial molecular structure. (b) Molecular structure with binding area of its surface. Blue represents positive charge, and red represents negative charge.
Official websites use .gov
A
.gov website belongs to an official
government organization in the United States.
Secure .gov websites use HTTPS
A lock (
) or https:// means you've safely
connected to the .gov website. Share sensitive
information only on official, secure websites.
Molecular structure of AKT1. (a) Initial molecular structure. (b) Molecular structure with binding area of its surface. Blue represents positive charge, and red represents negative charge.