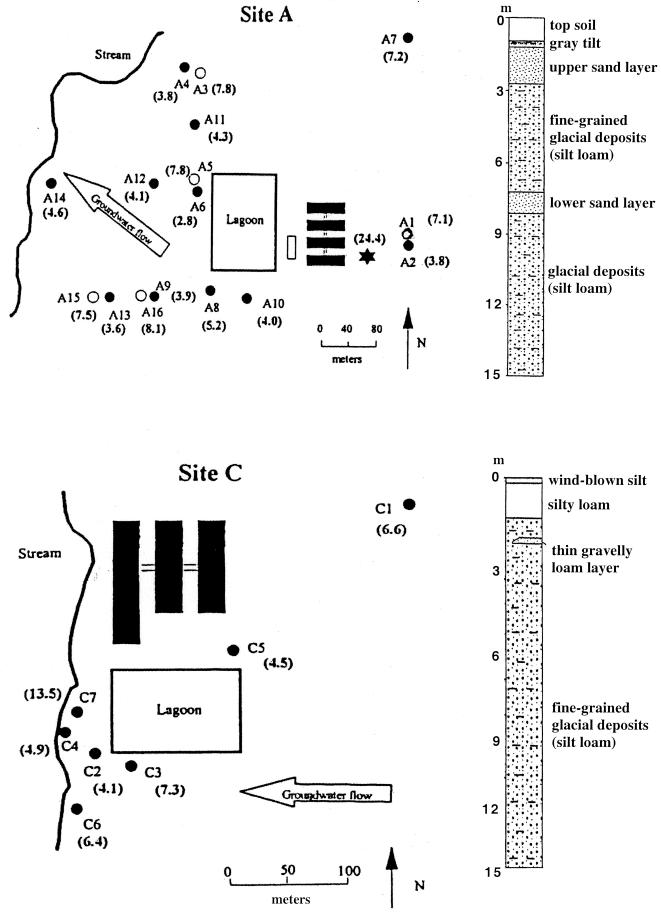
FIG. 1.
Maps of sites A and C and corresponding stratigraphic columns indicating the locations and characteristics of sand layers. The direction of groundwater flow is indicated by large open arrows, and the locations of monitoring wells are indicated by circles; open circles represent nested wells screened in deeper sand layers. Well depths (in meters) are indicated in parentheses. The solid rectangles represent confinement buildings.

