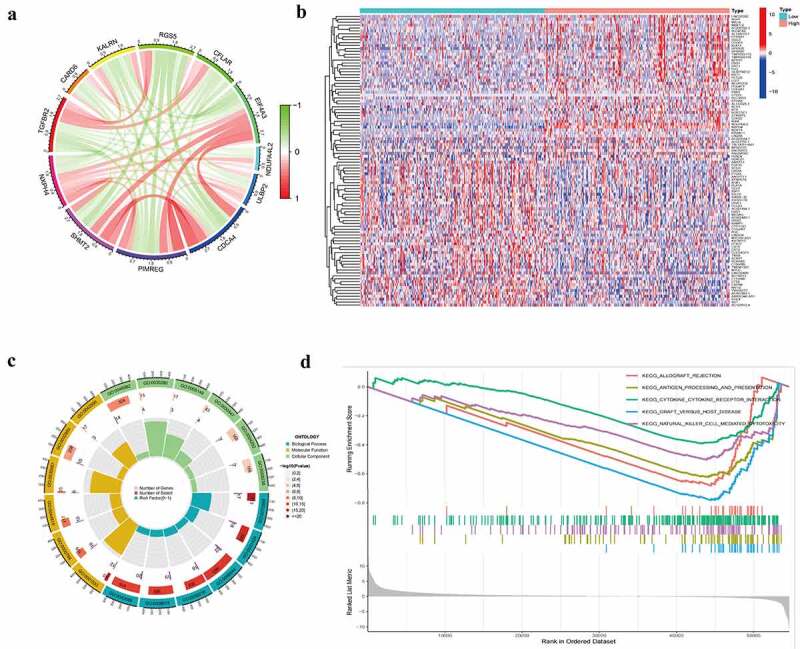
Figure 4.

Biological function of NXPH4 in BCa. Co-expressed genes significantly associated with NXPH4 were shown as correlation circle plots (a). Red, positive correlation; green, negative correlation. The top 50 upregulated DEGs and top 50 downregulated DEGs were displayed in the heatmap (b). Red, upregulated genes; blue, downregulated genes. Enrichment analysis is shown as a circle graph (c). GSEA was used to identify signaling pathways that were NXPH4-related differentially expression genes activated in BCa (d).
