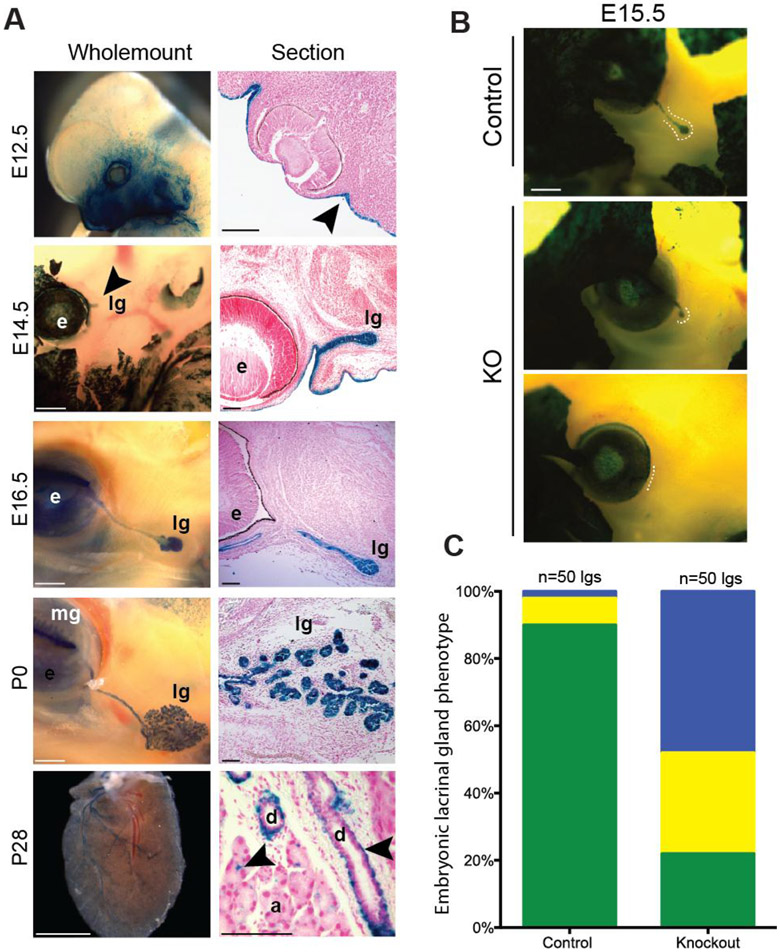
Fig. 3. miR-205 controls lacrimal gland initiation.
(A) Expression analysis of miR-205 in the lacrimal gland. Lacrimal gland (lg), meibomian gland (mg), eye (e). Surface ectoderm is indicated by arrowhead. Scattered lacZ staining around ducts (d) and acini cells (a) is indicated by arrowhead. Scale bars are 100 μM. (B) Representative images of E15.5 embryos with lacZ reporter. Dashed lines indicate the location of the lacrimal gland. Scale bars are 500 μM. (C) Quantification of phenotypes in control and miR-205−/− mice (p-value<0.001, Fisher’s exact test). Green: normal glands, yellow: runted glands, and blue: absent glands.

