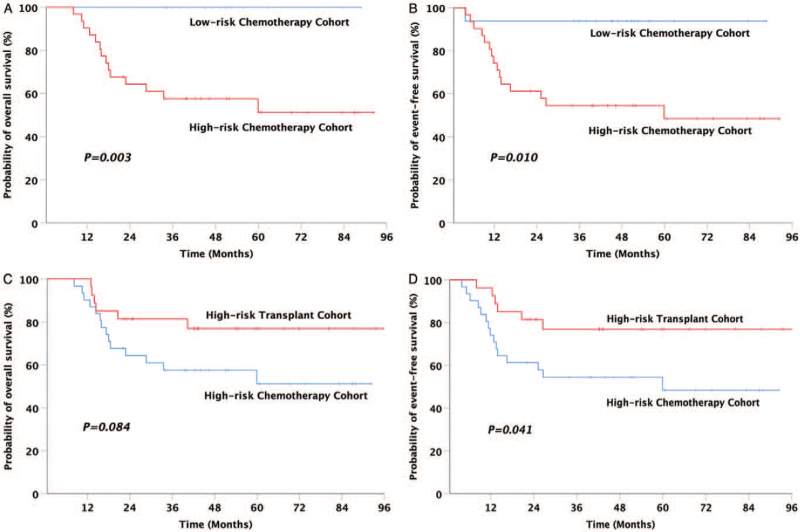
Figure 2.
Comparison of the outcomes in patients among the three cohorts. (A) OS for low-risk chemotherapy cohort (100%) vs. high-risk chemotherapy cohort (58.5%, 95% CI: 45.4–71.7%), (B) EFS for low-risk chemotherapy cohort (83.4%, 95% CI: 73.3–93.5%) vs. high-risk chemotherapy cohort (54.1%, 95% CI: 40.1–68.0%), (C) OS for high-risk chemotherapy cohort (58.5%, 95% CI: 45.4–71.7%) vs. high-risk transplant cohort (81.0%, 95% CI: 68.1–93.9%), and (D) EFS for high-risk chemotherapy cohort (54.1%, 95% CI: 40.1–68.0%) vs. high-risk transplant cohort (80.1%, 95% CI: 66.6–93.7%). CI: Confidence interval; EFS: Event-free survival; OS: Overall survival.

