
Figure 4.
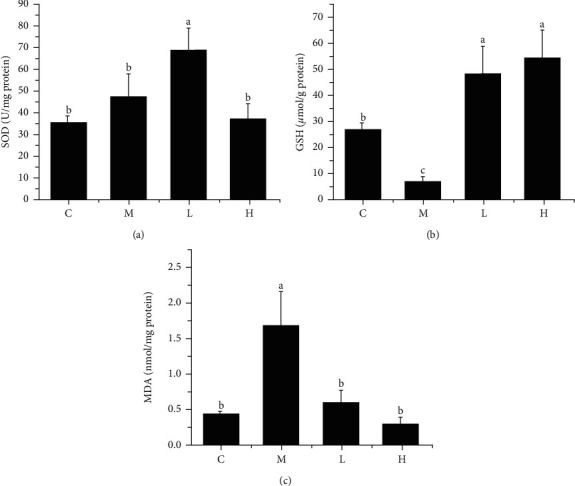
Effects of NSKP on liver oxidative stress in high-fat mice. (a) SOD (U/mg protein). (b) GSH (μmol/g protein). (c) MDA (nmol/mg protein). Bars marked with different letters represent statistically significant (P < 0.05), whereas bars labeled with the same letter indicate no statistically significant difference between the groups (P > 0.05). Values represent mean ± SEM; n = 10 in each group (SOD: superoxide dismutase, GSH: glutathione, MDA: malondialdehyde).