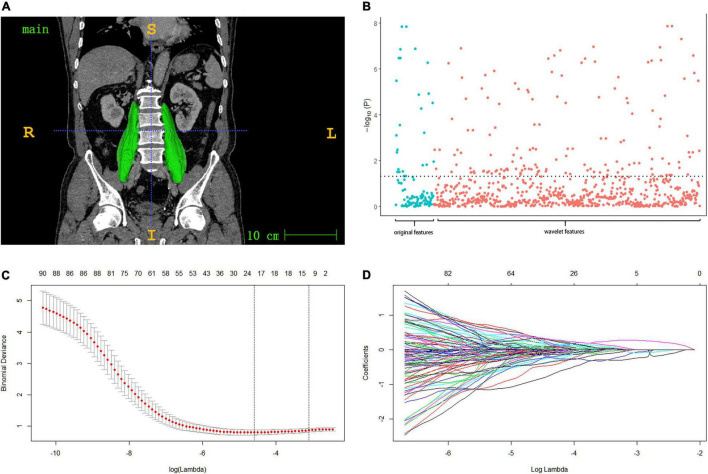
FIGURE 1.
(A) Muscle ROI: after the muscle region is labeled in ITK-SNAP software, semi-automatic drawing is adopted to check the psoas major muscle region and 3d reconstruction. (B) Manhattan plot presenting the strength of association –log10 (p-value) of spearman’s rho between the psoas radiomic features and the original sarcopenia (diagnosed by SMI, grip strength and walking speed). (C,D) Model with smallest lambda was selected lambda 0.0451, ln (lambda) –3.098, and 14 features selected from the lasso were included in the subsequent radiomic score model.

