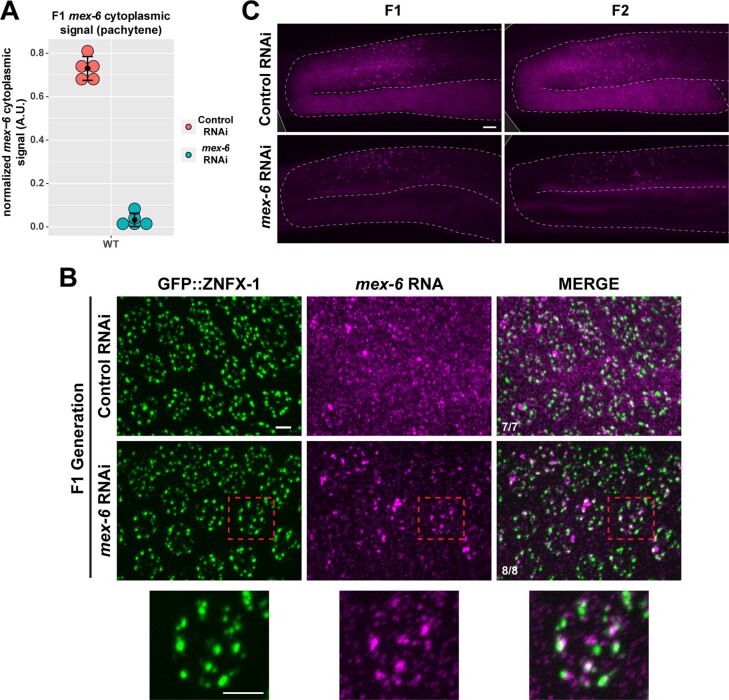
Extended Data Fig. 3. Transgenerational analysis of the mex-6 transcript upon RNAi.
a) Graph comparing the mean mex-6 RNA FISH signal from the pachytene rachis in wild-type F1 progeny of P0s administered either control (red) or mex-6 (blue) RNAi. Each dot represents a single worm (n = 5 worms). Central black dot and error bars represent the mean and standard deviation, respectively. Values (arbitrary units) were normalized to puf-5 RNA FISH signals visualized in same region (Methods). b) Maximum projection photomicrographs of pachytene nuclei showing the nuage marker GFP::ZNFX-1 (green) and mex-6 RNA (magenta) in F1 progeny of animals exposed to mex-6 RNAi. Bottom rows shows high-resolution images of a single pachytene nucleus. Scale bar is 2.5 µm. Images are representative of 7 worms examined in the control condition and 8 worms examined in the mex-6 RNAi condition. Results were consistent across two independent FISH experiments. c) Maximum projection photomicrographs showing mex-6 RNA in germlines from F1 and F2 progeny derived from P0 animals exposed to mex-6 or control RNAi conditions. Scale bar is 10 µm. Images are representative of 6 worms examined in each condition. This experiment was performed once.

