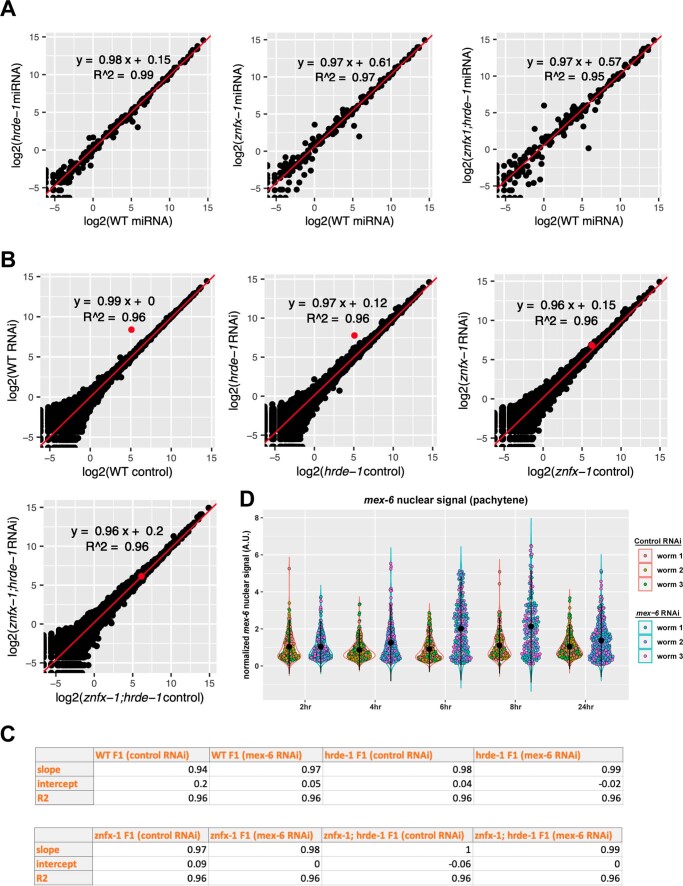
Extended Data Fig. 9. sRNAseq quality control analysis.
a) Scatter plots comparing miRNA RPMs in wild-type (X-axis) and mutants (Y-axis) as indicated under control RNAi conditions. Linear regression is used to fit the data. miRNA counts in each condition are averaged across two replicates. b) Scatter plots comparing sRNA RPMs in the F1 progeny of control and mex-6 RNAi fed P0 worms for the indicated genotypes. Each dot corresponds to a locus in the C. elegans genome. The red dot corresponds to the mex-6 locus. Linear regression is calculated without mex-6 sRNA counts. sRNA counts in each condition were averaged across two replicates. c) Linear regression statistics modelling the relationship between the two sRNAseq replicates for each genotype in both control and mex-6 RNAi conditions. d) Super plot showing data from Fig. 2d with nuclei colour-coded to indicate worm origin. Central black dot and error bars represent the mean and standard deviation respectively. The distribution of values from each worm overlap. See legend for Fig. 2d for further description.

