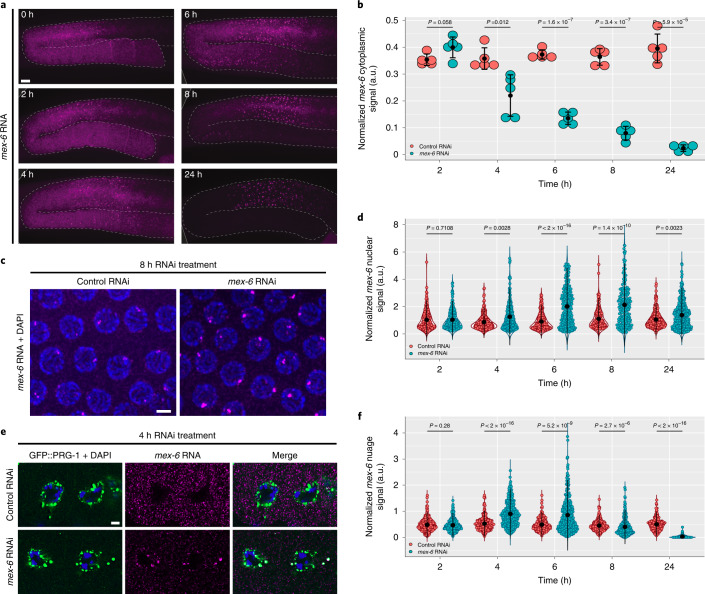
Fig. 2. Evolution of mex-6 RNA in P0 generation wild-type hermaphrodites over 24 h of RNAi treatment.
a, Maximum projection photomicrographs of germlines oriented as in Fig. 1, with mex-6 RNA (magenta) detected through FISH hybridization at the indicated times post the onset of RNAi feeding. Scale bar, 10 µm. Images are representative of eight worms examined for each condition. b, Comparison of the mean cytoplasmic the mex-6 RNA FISH signals (diplotene region) in control and mex-6 RNAi conditions at the indicated time points of RNAi treatment. Each dot represents a single germline (n = 5 germlines). c, Maximum projection photomicrographs of pachytene nuclei showing mex-6 RNA (magenta) and DNA (blue, stained with DAPI) after 8 h of RNAi treatment. Scale bar, 2.5 µm. Images are representative of three worms examined for each condition. d, Comparison of maximum nuclear mex-6 RNA FISH signals (pachytene region) in control and mex-6 RNAi conditions at the indicated time points of RNAi treatment. Each dot represents one nucleus. Nuclei were quantified across three worms. e, Single z-plane photomicrographs of two oocytes stained for the nuage marker GFP::PRG-1 (green), DNA (DAPI; blue) and mex-6 RNA (magenta) after 4 h of RNAi treatment. Scale bar, 2.5 µm. Images are representative of five worms examined for each condition. Results were consistent across three independent FISH experiments for a,c,d. f, Comparison of the average mex-6 RNA FISH signal in nuage (diplotene) in control and mex-6 RNAi conditions at the indicated time points of RNAi treatment. Each dot corresponds to a nuage granule. Nuage granules were quantified across five worms. b,d,f, Values were normalized to puf-5 RNA FISH signals visualized in the same germline (b), nucleus (d) or nuage granule (f). The central black dot and error bars represent the mean and s.d., respectively. P values were calculated using an unpaired two-tailed Student’s t-test (b) or unpaired two-tailed Wilcoxon rank-sum test (d,f); a.u., arbitrary units. The exact number of nuclei (d) and nuage granules (f) quantified for each condition are provided in Source Data.

