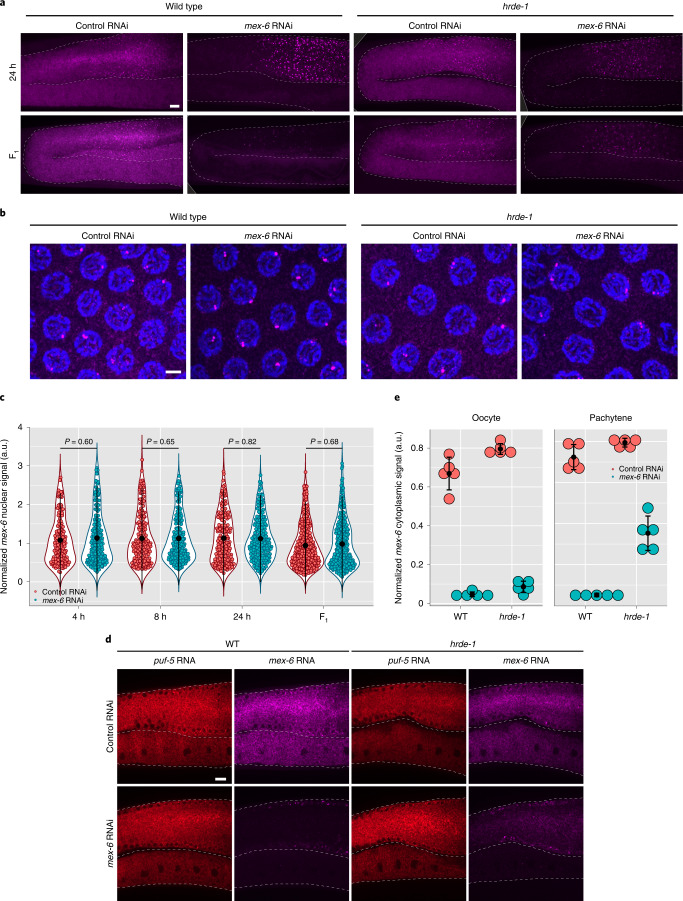
Fig. 4. RNAi-induced changes in nascent transcripts require hrde-1.
a, Maximum projection photomicrographs of germlines showing mex-6 RNA (magenta) in P0 (24 h RNAi exposure; top) and F1 wild-type (bottom) and hrde-1 mutants under control or mex-6 RNAi conditions. Scale bar, 10 µm. Images are representative of eight worms examined for each condition. b, Maximum projection photomicrographs of pachytene nuclei in P0 wild-type and hrde-1 mutant animals stained for mex-6 RNA (magenta) and DNA (stained with DAPI; blue) following 8 h of either control or mex-6 RNAi treatment. Scale bar, 2.5 µm. Images are representative of four worms examined for each condition. c, Comparison of the maximum nuclear mex-6 RNA FISH signals (pachytene region) in P0 hrde-1 mutants following either control or mex-6 RNAi at the indicated time points. Each dot represents one nucleus. Nuclei were quantified across three worms (the exact number of nuclei quantified for each condition are provided in Source Data). P values were calculated using an unpaired two-tailed Wilcoxon rank-sum test. Refer to Fig. 2d for comparison to the wild type. d, Single z-plane photomicrographs showing mex-6 RNA (magenta) and control puf-5 RNA (red) in the cytoplasm in the pachytene and oocyte regions comparing hrde-1 mutant and wild-type animals following 24 h of RNAi treatment. In wild-type worms, mex-6 RNA is depleted in both regions but it is only partially depleted in the pachytene region of hrde-1 mutants, consistent with a failure to silence the locus. Scale bar, 10 µm. Images are representative of eight worms examined for each condition. a,b,d, Results were consistent across three independent FISH experiments. e, Comparison of the mean mex-6 RNA levels in the cytoplasm of oocytes and the pachytene region in hrde-1 mutant and wild-type animals following 24 h of RNAi treatment. Each dot represents one animal (n = 5 worms). c,e, Values (arbitrary units, a.u.) were normalized to puf-5 RNA FISH signals visualized in the same nuclei (c) or areas (e; Methods). The central black dot and error bars represent the mean and s.d., respectively.

