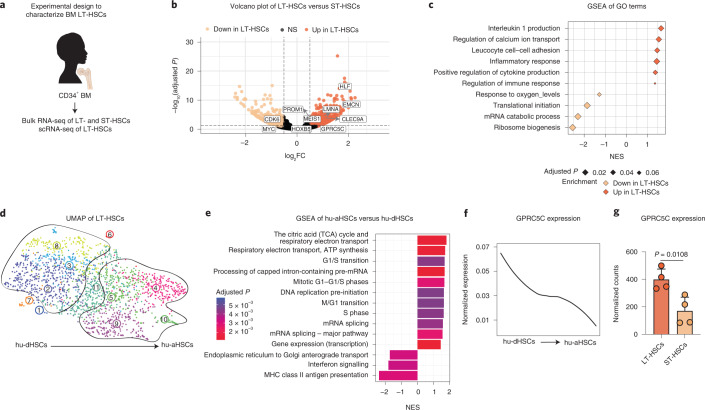
Fig. 1. Identification of a highly dormant HSC population in human BM.
a, Experimental design to characterize LT-HSCs from human BM donors. b, Volcano plot depicting DEGs between LT-HSCs and ST-HSCs from four BM donors. Benjamini–Hochberg (BH)-adjusted P values after Wald test. log2FC ≥0.5; adjusted P < 0.1. c, GSEA of GO terms in LT-HSCs compared with ST-HSCs. Normalized enrichment score (NES). d, UMAP of single-cell transcriptomes of human BM LT-HSCs from two donors highlighting VarID clusters. Numbers denote clusters. e, GSEA for genes that were differentially expressed between clusters 4, 5, 9 and 10 (hu-aHSCs) and 2, 3 and 8 (hu-dHSCs). BH-corrected P ≤ 0.05. f, Smoothed pseudo-temporal normalized expression profile of GPRC5C in LT-HSCs. Smoothed profiles were computed by local regression. g, Bulk RNA-seq data depicting normalized counts of GPRC5C in LT-HSCs and ST-HSCs. n = 4 biological replicates. Two-tailed t-test was performed. Data are presented as mean ± s.d. The y axis of the smoothed pseudo-temporal expression profiles indicates normalized expression. GSEA was performed with BH-adjusted P values after adaptive multi-level splitting Monte Carlo approach. LT-HSCs (CD34+CD38−CD45RA−CD90+CD49f+), ST-HSCs (CD34+CD38−CD45RA−CD90−CD49f−) and HSCs (CD34+CD38−). Source numerical data are available in source data.

