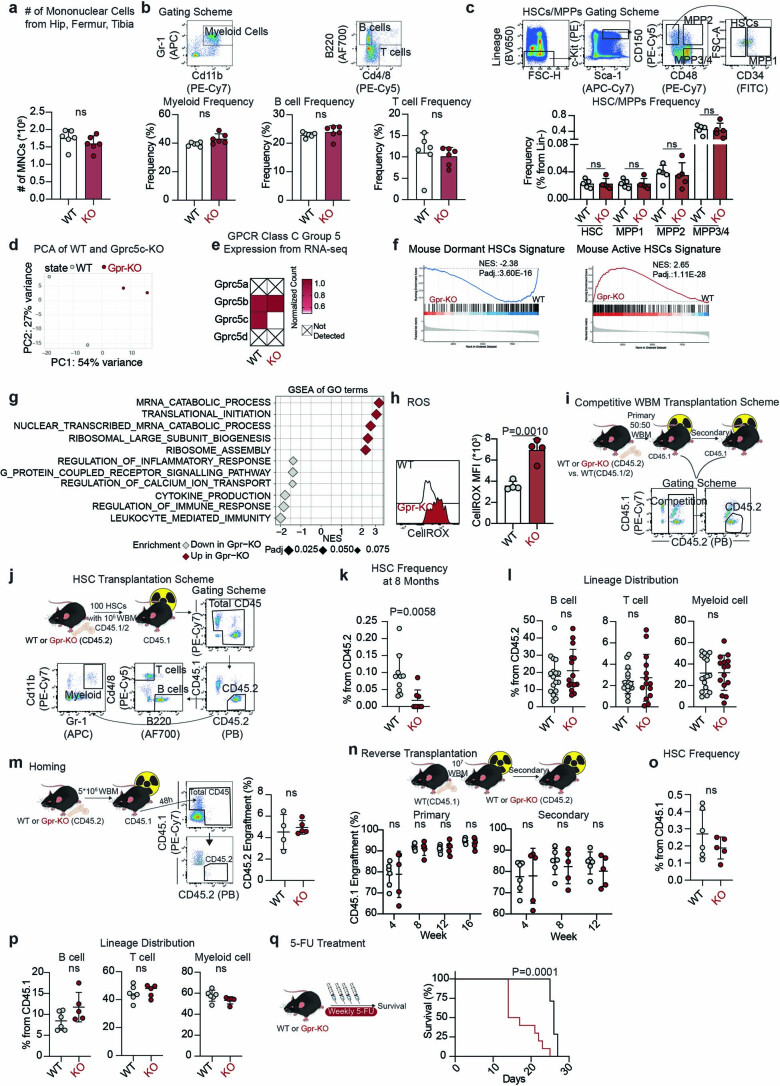
Extended Data Fig. 5.
a. Absolute number of mononuclear cells (MNC) isolated from hip, femur, and tibia. n = 6 biological replicates. b. FACS gating scheme for myeloid, B cells and T cells. Frequency of described populations from Gprc5c-KO and WT control BM. n = 6 biological replicates. c. Upper panel: FACS gating scheme for HSCs (LSK-CD150+CD48+CD34−), MPP1 (LSK-CD150+CD48+CD34+), MPP2 (LSK-CD150+CD48+), and MPP3/4 (LSK-CD150−CD48+). Lower panel: frequency of described populations from Gprc5c-KO and WT control BM. n = 5 biological replicates. d. PCA of RNA-seq data from Gprc5c-KO and WT control HSCs. Based on top 5,000 variable genes. log2FC threshold ≥ 0.5, padj.<0.1. e. Differential gene expression. Heatmap representing mean of normalized counts (normalized to WT). n = 2 biological replicates. f. GSEA of gene signatures in Gprc5c-KO and WT control HSCs. g. GSEA of GO terms in Gprc5c-KO compared to WT control HSCs. h. FACS measurement of CellROX Deep Red MFI in Gprc5c-KO compared to WT control HSCs. n = 4 biological replicates. i. Experimental design for competitive WBM transplantation. 50:50 ratio transplant of CD45.1/2 WT: CD45.2 WT or Gprc5c-KO WBM into CD45.1 recipient mice. Representative FACS gating scheme to quantify engraftment. j. Experimental design for HSC transplantation and FACS gating scheme to quantify engraftment and lineage distribution. k. Endpoint frequency of BM HSCs in CD45.2 cells of Gprc5c-KO (n = 8 biological replicates) and WT control (n = 10 biological replicates). l. Lineage distribution of BM Gprc5c-KO (n = 14 biological replicates) and WT control (n = 16 biological replicates) from HSC transplantations. m. Left panel: experimental design and FACS gating scheme of homing assay. Right panel: frequency of CD45.2 cells engraftment 48 hours post transplantation. n = 4 biological replicates. n. Upper panel: experimental design for reverse chimeras. Lower panel: PB analysis of reverse chimeras. Engraftment is represented by CD45.1 cell percentage engraftment. n = 5 biological replicates for Gpr-KO and n = 6 biological replicates for WT mice. o. Endpoint frequency of BM HSCs from CD45.1 cells transplanted in Gprc5c-KO (n = 5 biological replicates) and WT control (n = 6 biological replicates) mice. p. Lineage distribution of BM CD45.1 cells transplanted in Gprc5c- KO (n = 5 biological replicates) and WT control (n = 6 biological replicates) mice. q. Survival curve of Gprc5c-KO (n = 10 biological replicates) and WT control (n = 7 biological replicates) mice treated with 5-FU. All data presented as mean ± SD. Statistical significance was determined using two-tailed t-test, except panel q: Mantel-Cox test. GSEA performed with BH-adjusted p-values after adaptive multilevel splitting Monte Carlo approach. ns, not significant. n indicates the number of biological replicates. Source numerical data are available in source data.

