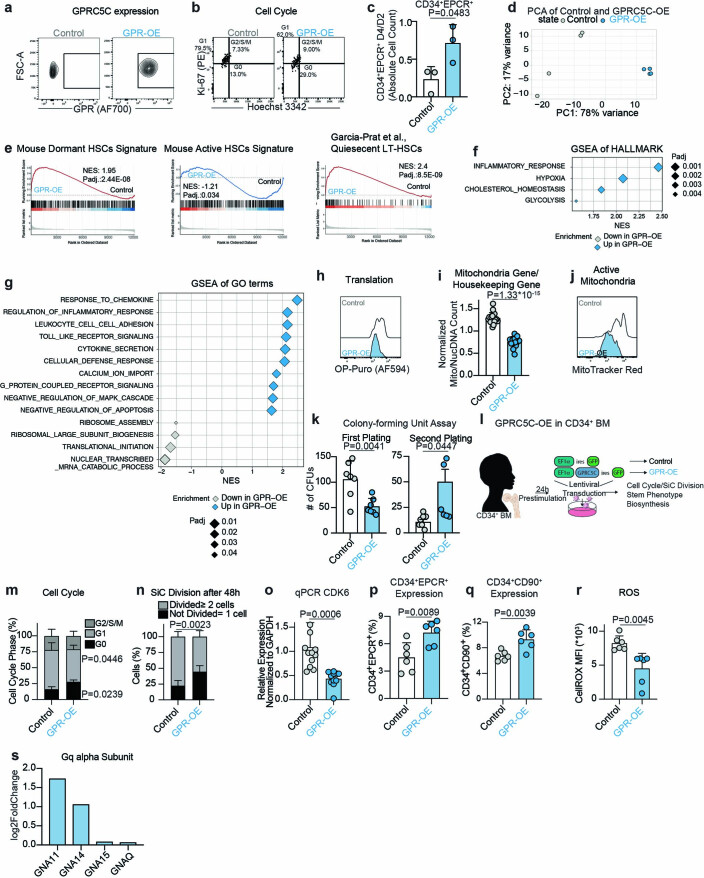
Extended Data Fig. 6.
a. Representative FACS plot for validation of GPRC5C-OE in GFP+ mPB cells. b. Representative FACS plot of cell cycle profiles from GFP+ mPB cells. c. Ratio of the absolute number of CD34+EPCR+ cells from day 4 compared to day 2 in vitro. n = 3 experiments. d. PCA of RNA-seq data from GPRC5C-OE and control. Based on top 5,000 variable genes. log2FC threshold ≥ 0.5, padj. < 0.1. e. GSEA of quiescent signatures in GPRC5C-OE compared to control. f. GSEA of Hallmarks terms in GPRC5C-OE compared to control. g. GSEA of GO terms in GPRC5C-OE compared to control. h. FACS histogram of OP-Puro MFI in GPRC5C-OE and control. i. RNA-seq data showing ratio read count of mitochondria genes normalized to housekeeping genes (GAPDH, ACTB, PPIA). n = 19 genes averaged from 4 technical replicates. j. FACS histogram of MitoTracker Red MFI in GPRC5C-OE and control. k. CFU assay of GFP+ cells from GPRC5C-OE and control. n = 7 experiments, except for secondary plating GPR-OE, where n = 6 experiments. l. Experimental design to overexpress and assess the impact of the gain of GPRC5C expression in BM CD34 + . m. FACS-based cell cycle analysis of GPRC5C-OE and control. n = 6 experiments. n. SiC division assay of GPRC5C-OE and control quantified after 48 hours in vitro culture. n = 6 experiments. o. qPCR of CDK6 expression. Normalized to housekeeping gene GAPDH and control. n = 12 experiments for WT and n = 11 experiments for GPR-OE. p. Surface expression of CD34+EPCR+ in GPRC5C-OE and control. n = 6 experiments. q. Surface expression of CD34+CD90+ in GPRC5C-OE and control. n = 4 experiments. r. FACS measurement of CellROX Deep Red MFI in GPRC5C-OE and control. n = 6 experiments. s. Log2FC of proteins of Gq alpha subunit. All data presented as mean ± SD. Statistical significance was determined using two-tailed t-test, except m and n (two-way ANOVA). GSEA performed with BH-adjusted p-values after adaptive multilevel splitting Monte Carlo approach. ns, not significant. n indicates the number of biological replicates. For all experiments, at least two independent experiments were performed. At least two human BM donors were used. Source numerical data are available in source data.

