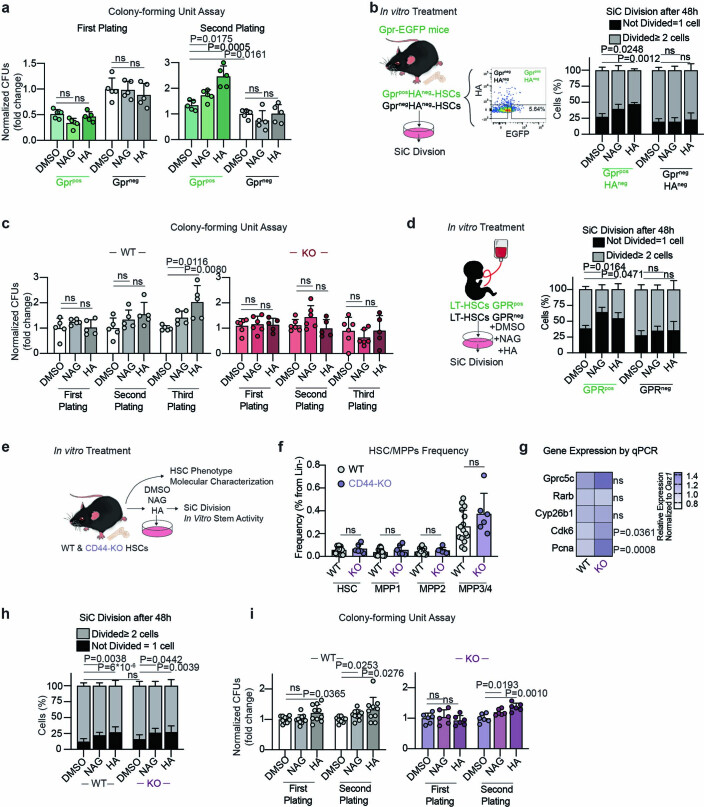
Extended Data Fig. 8.
a. Serial CFU assay of Gprc5cpos/neg–HSCs cultured in NAG, HA, or DMSO control for 72 hours. n = 6 biological replicates. b. Left panel: experimental design to assess the effect of in vitro HA, NAG, and DMSO treatment on HAnegGprc5cpos/neg–HSCs. Right Panel: SiC division assay of HAnegGprc5cpos/neg–HSCs quantified after 48 hours in vitro culture treatment with NAG, HA, and DMSO. n = 5 biological replicates. c. Serial CFU assay of Gprc5c-KO and WT control HSCs cultured in NAG, HA, and DMSO control for 72 hours. n = 5, 3, 5, 6, 6, and 5 biological replicates for WT-DMSO, WT-NAG, WT-HA, Gpr-KO-DMSO, Gpr-KO-NAG, and Gpr-KO-HA, respectively. d. SiC division assay of GPRC5Cpos/neg–LT-HSCs with in vitro culture treatment for 48 hours with NAG, HA, and DMSO control. n = 4 biological replicates. e. Experimental design to assess the effect of in vitro NAG, HA, and DMSO treatment on CD44-KO and WT control mice. f. Frequency of HSC/MPP populations from 8−week-old CD44-KO (n = 6 biological replicates) and WT control (n = 12 biological replicates) mice. g. Differential gene expression. Heatmap representing median RNA expression from qPCR data (normalized to housekeeping gene Oaz1 and WT control). n = 7 biological replicates. h. SiC division assay of CD44-KO and WT control HSCs quantified after 48 hours in vitro culture treatment with NAG, HA and DMSO. n = 15, 15, 13, 8, and 12 biological replicates for WT-DMSO, WT-NAG, WT-HA, CD44-KO-DMSO, CD44-KO-NAG, and CD44-KO-HA, respectively. i. Serial CFU assay of CD44-KO (n = 6 biological replicates) and WT control (n = 10 biological replicates) HSCs cultured in vitro with NAG, HA, and DMSO for 48 hours. All data presented by mean ± SD. Statistical significance was determined using two-tailed t-test (a, c, f, g, i) or two-way ANOVA (b,d, h). ns, not significant. n indicates number of biological replicates. For all experiments, at least two independent experiments were performed. Source numerical data are available in source data.

