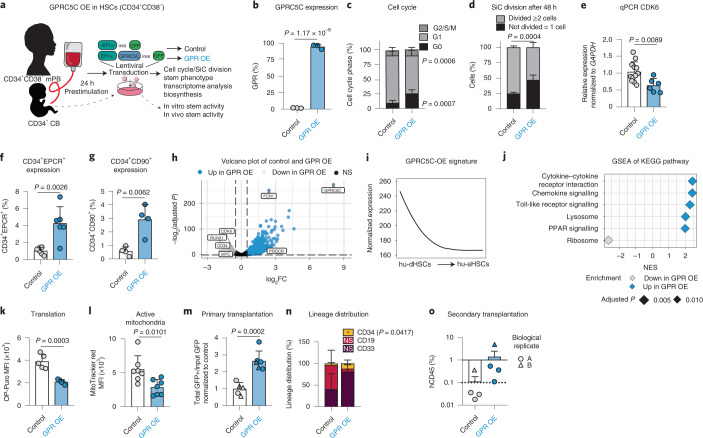
Fig. 4. GPRC5C OE enhances stemness.
a, Experimental design of GPRC5C OE in mPB and CB. Internal ribosomal entry site (ires). b, FACS validation of GPRC5C OE at protein level. n = 3 experiments. c, FACS-based cell cycle analysis of GPRC5C OE and control. n = 6 experiments. d, SiC division assay of GPRC5C OE and control quantified after 48 h in vitro culture. n = 4 experiments. e, qPCR of CDK6 expression. Normalized to housekeeping gene GAPDH and control. n = 6 experiments for GPRC5C OE and n = 12 experiments for control. f, Surface expression of CD34+EPCR+ in GPRC5C OE and control. n = 6 experiments. g, Surface expression of CD34+CD90+ in GPRC5C OE and control. n = 4 experiments. h, Volcano plot depicting DEGs between GPRC5C OE and control. Key genes associated with dormancy and stemness are highlighted. BH-adjusted P values after Wald test. log2FC ≥0.5; adjusted P < 0.1. i, Smoothed pseudo-temporal expression profile of the GPRC5C-OE signature in LT-HSCs. Smoothed profiles were computed by local regression. The y axis indicates normalized expression. j, GSEA of KEGG pathways in GPRC5C OE compared with control. Performed with BH-adjusted P values after adaptive multi-level splitting Monte Carlo approach. k, FACS measurement of OP-Puro MFI in GPRC5C OE and control. n = 5 experiments. l, FACS measurement of MitoTracker Red MFI in GPRC5C OE and control. n = 7 experiments. m, Transplantation of GPRC5C OE and control in CB cells from two biological replicates. Engraftment was measured from BM and calculated by the ratio of the total percentage GFP+hCD45+ to the percentage input GFP post-transplantation and normalized to control. n = 5 control and n = 6 GPR-OE biological replicates. n, Lineage distribution of GPRC5C OE and control in CB cells. Distribution of myeloid (CD33), B-lymphoid (CD19) and immature surface phenotype (CD34) are presented. n = 5 control and n = 6 GPR-OE biological replicates. o, Secondary transplantation of 150,000 GFP+hCD45+ cells. n = 4 biological replicates. All data presented as mean ± s.d. Statistical significance was determined using two-tailed t-test (b, e, f, g, l, m, n and k) or two-way ANOVA (c and d). n indicates number of replicates. For all experiments, at least two independent experiments were performed. At least two human mPB or CB donors were used. Source numerical data are available in source data.

